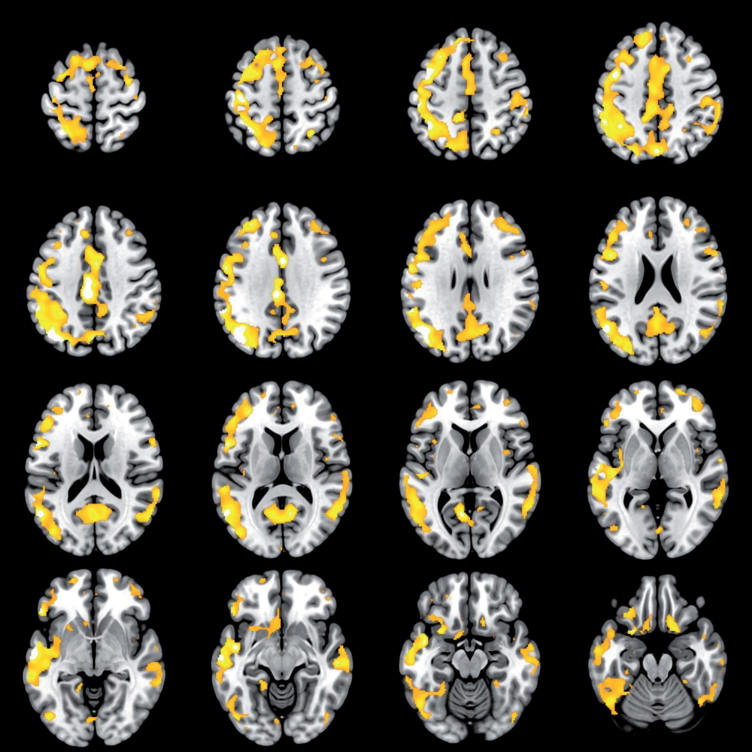
Fig.2.
Brain regions showing a correlation between higher [11C]PIB uptake and slower processing speed z-score. The colored areas represent brain regions where the correlation between higher [11C]PIB uptake and slower processing speed z-score was significant. The color scale starts from the height threshold T = 4.8 (p < 0.05 when T = 4.8, family-wise error corrected), brighter colors represent a more significant correlation. The voxel-to-voxel analysis was performed with Statistical Parametric Mapping (SPM12).

