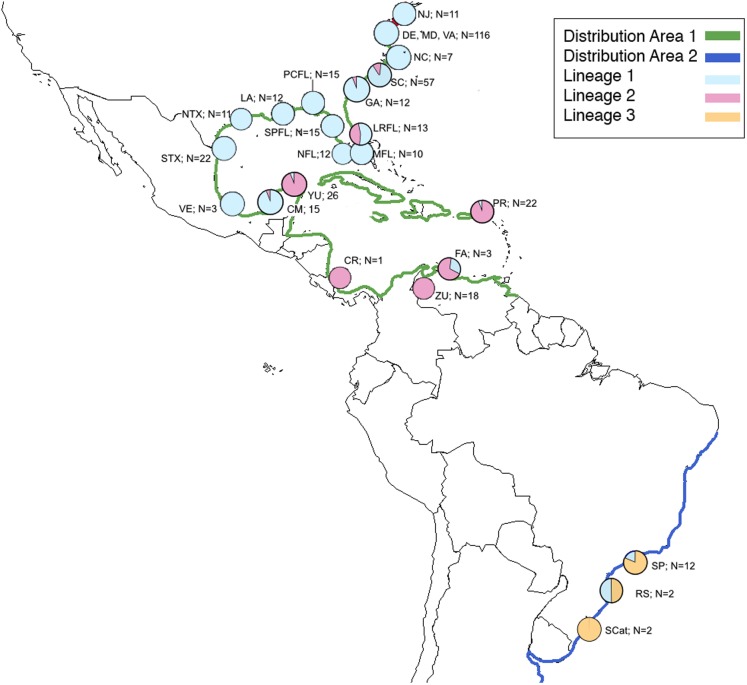
Figure 1. Map of natural distribution of C. sapidus along with collection locations and number of specimens successfully sequenced for this study showing proportion of each lineage in each location.
Map of natural distribution of C. sapidus along with collection locations and number of specimens successfully sequenced for this study showing proportion of each lineage in each location. Green, Distribution 1; dark blue, Distribution 2; light blue, Lineage 1; pink, Lineage 2; orange, lineage 3; NJ, New Jersey; DE, Delaware; MD, Maryland; VA, Virginia; NC, North Carolina; SC, South Carolina; GA, Georgia; LRFL, Loxahatchee River, Florida; MFL, Miami, Florida; NFL, Naples, Florida; SPFL, St. Petersburg, Florida; PCFL, Panama City, Florida; LA, Louisiana; NTX; northern Texas; STX, southern Texas; VE, Veracruz, México, CM, Campeche, México; YU, Yucatán, Mexico; CR, Costa Rica; ZU, Zulia, Venezuela; FA, Falcón, Venezuela; PR, Puerto Rico; SP, São Paulo, Brazil; RGS, Rio Grande do Sul, Brazil; SCat; Santa Catarina, Brazil.

