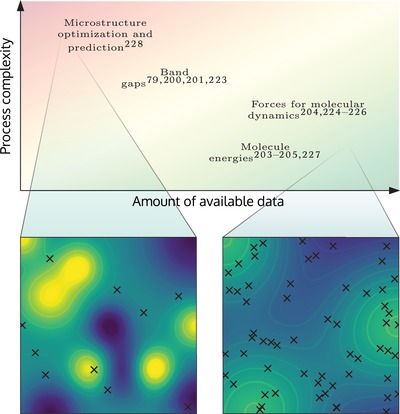
Figure 8.

The machine learning domain in terms of data volume and the complexity of the physical process, with selected examples placed in this domain. The complexity of a physical process here means the complex, nonlinear structures present in the data. Two opposing learning scenarios, a hard and an easy one, are illustrated in the lower panel. In these two cases, the underlying physical process is represented by a colored contour map, and the sampling of this process is represented by black crosses.223, 224, 225, 226, 227, 228
