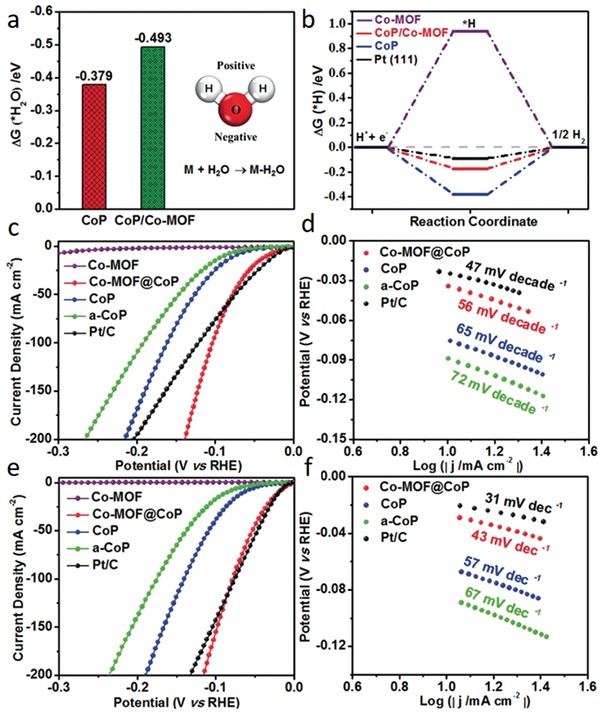
Figure 8.

The calculated free‐energy diagram for a) water and b) hydrogen adsorption on different catalysts. c) HER polarization curves and d) corresponding Tafel plots of the catalysts in 1 m KOH. e) HER polarization curves and f) corresponding Tafel plots of catalysts in 0.5 m H2SO4. a–f) Reproduced with permission.[qv: 76g] Copyright 2019, Wiley‐VCH.
