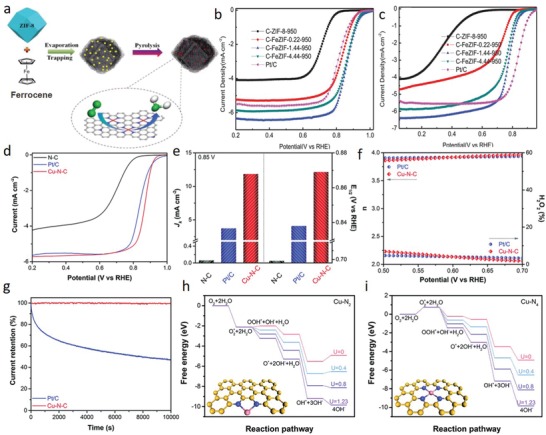
Figure 10.

a) Synthesis strategy for preparation of Fe–N–C catalysts. b,c) ORR polarization curves of various catalysts in O2‐saturated b) 0.1 m KOH and c) 0.1 m HClO4. a–c) Reproduced with permission.86 Copyright 2019, Wiley‐VCH. d) ORR polarization curves and e) kinetic currents (J K) (at 0.85 V) and half‐wave potentials for Cu–N–C, N–C and Pt/C catalysts in O2‐saturated 0.1 m KOH solution. f) Electron transfer number (n) and H2O2 yield for Cu–N–C and Pt/C. g) i–t curves of Cu–N–C and Pt/C for 10 000 s at a constant potential. Calculated free‐energy diagram for ORR on h) Cu–N2 and i) Cu–N4 active sites. The inset structures represent the optimized structures of Cu–N2 and Cu–N4. The yellow, blue, and light pink balls represent carbon, nitrogen, and copper atoms, respectively. d–i) Reproduced with permission.65 Copyright 2018, The Royal Society of Chemistry.
