
Figure 8.
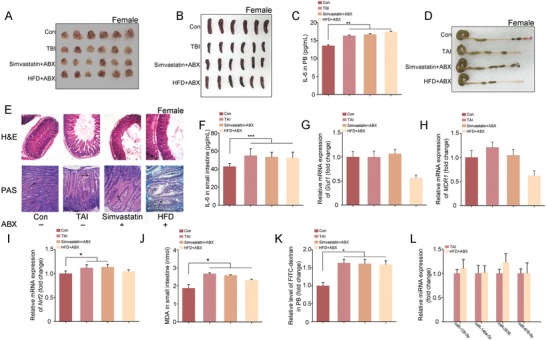
Gut microbiota contributes to the radioprotective effects of simvastatin and HFD in female mice. The mice were housed with antibiotic mixture (ABX) in drinking water. A,B) Photographs of thymuses A) and spleens B) from female mice in the four groups, the thymuses and spleens were obtained at day 21 after 4 Gy TBI. n = 18 per group. C) The level of IL‐6 in PB was examined. Significant differences are indicated: *P < 0.05 by Student's t‐test between each two cohort, n = 18 per group. D) Photograph of dissected colon from female mice in the four groups. E) The morphology of the small intestine from female mice was shown by H&E and PAS staining. The black arrows point to the goblet cells. F) The level of IL‐6 in small intestine tissues was examined by ELISA. Significant differences are indicated: *P < 0.05 by Student's t‐test between each two cohort, n = 18 per group. G–I) The expression levels of Glut1 G), MDR1 H), and Nrf2 I) were examined in small intestine tissues by quantitative PCR. Significant differences are indicated: *P < 0.05 by Student's t‐test between each two cohort, n = 18 per group. J) The level of MDA was assessed in small intestine tissue. Significant differences are indicated: *P < 0.05 by Student's t‐test between each two cohort, n = 18 per group. K) The level of FITC‐dextran in PB was assessed. Significant differences are indicated: *P < 0.05 by Student's t‐test between each two cohort, n = 18 per group. L) The expression levels of miRNAs were examined in small intestine tissues by quantitative PCR. Significant differences are indicated by Student's t‐test between each two cohort, n = 18 per group.