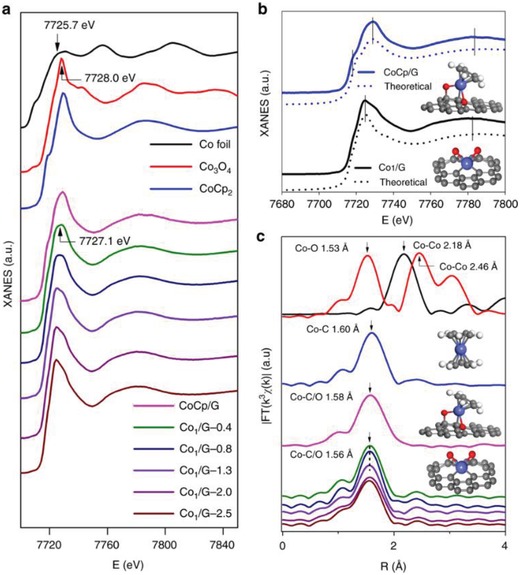
Figure 5.

Co K‐edge XAFS and EXAFS spectra of CoCp/G, Co1/G SACs. a) Co K‐edge XANES spectra. b) The experimental XANES curves and calculated XANES data of optimized DFT‐modeled structures of Co1/G and CoCp/G. c) Fourier transform EXAFS of these samples with the corresponding structures (insets). The balls in gray, white, red, and blue represent carbon, hydrogen, oxygen, and cobalt, respectively. Reproduced with permission.42 Copyright 2018, Nature Publishing Group.
