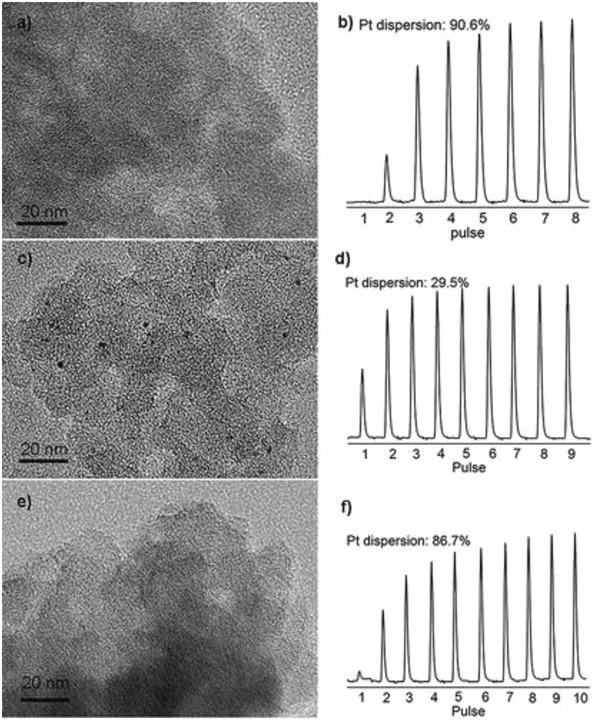
Figure 8.

a,e) TEM images and b,f) corresponding H2 pulse titration profiles of two carbon materials supported Pt SACs. c,d) TEM image and corresponding H2 pulse titration profile of one carbon materials supported Pt SACs. The titration ends as the peak intensities reach a constant value. Reproduced with permission.[qv: 88b] Copyright 2019, American Chemical Society.
