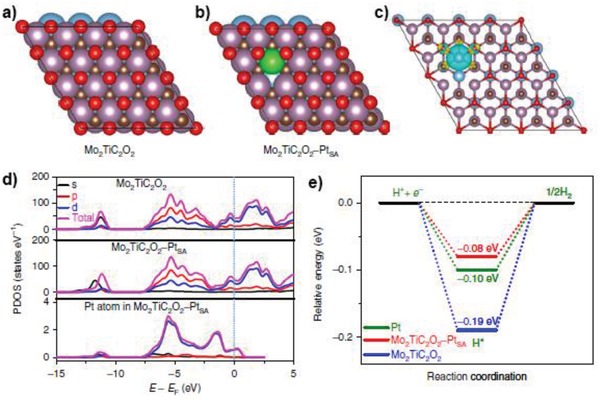
Figure 16.

Top view of the slab models used to describe a) Mo2TiC2O2 and b) Mo2TiC2O2–PtSA. Atoms in blue, purple, green, brown, and red represent Ti, Mo, Pt, C, and O, respectively. c) Calculated charge density distribution differences between Mo2TiC2O2 and Mo2TiC2O2–PtSA.The isosurface value is 0.01 e A−3 to better plot the differences. d) Calculated PDOS of Mo2TiC2O2 and Mo2TiC2O2–PtSA, with aligned Fermi level. e) Calculated free energy profiles of HER at the equilibrium potential for Mo2TiC2O2, Mo2TiC2O2–PtSA and Pt/C. Reproduced with permission.29 Copyright 2018, Nature Publishing Group.
