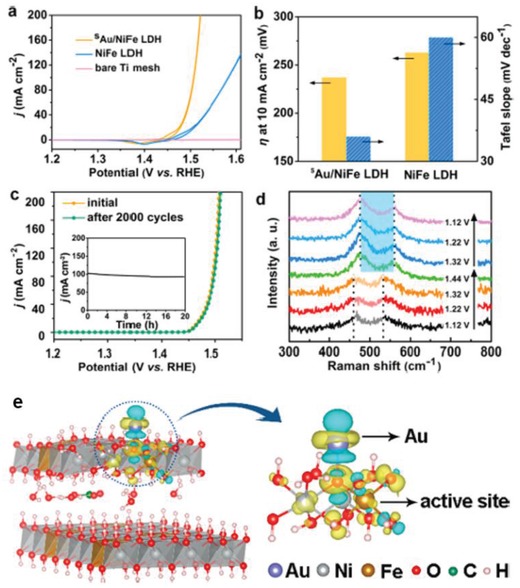
Figure 20.

a) CV curves of sAu/NiFeLDH, pure NiFe LDH and bare Ti mesh in 1 m KOH. b) Overpotential at 10 mA cm−2 and Tafel slope for sAu/NiFe LDH and pure NiFe LDH. c) Polarization curves of sAu/NiFe LDH before and after 2000 cycles. d) Raman spectra of sAu/NiFe LDH at different potentials in a CV cycle. e) Differential charge densities of NiFe LDH with and without Au atom when one O atom is adsorbed on the Fe site. Reproduced with permission.112 Copyright 2018, American Chemical Society.
