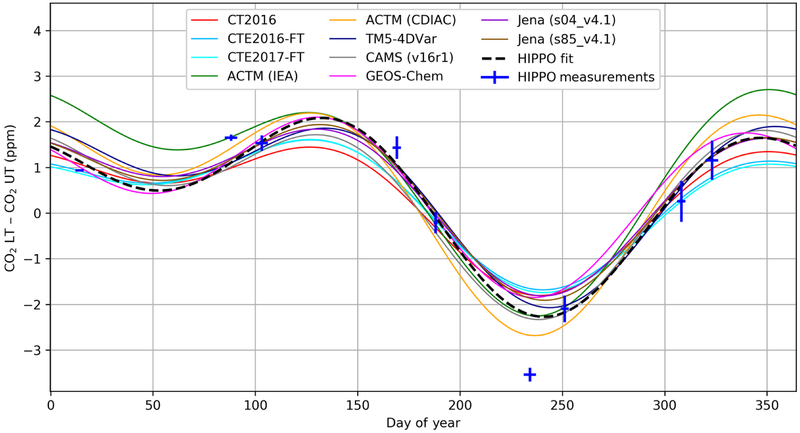
Figure 1.
Reconstructed annual cycle in northern extratropical vertical CO2 gradients, obtained from fits using two harmonics of the HIPPO data and correspondingly sampled model outputs, averaged over 20 to 90° N (1000 to 800 hPa minus 800 to 400 hPa). The CO2 average curtain observations for each of nine atmospheric transects have been added on the graph to illustrate the data uncertainties and temporal coverage, the y-axis error bar is derived from the range of disagreement among the three in situ instruments on board (QCLS, OMS, and AO2; see Supplement), and the line average is derived from the CO2.X merged dataset. The horizontal whiskers represent the time span of the flights contributing to each average. The observed line shown here is not a direct fit to the observation points, but rather comes from an average of fits to individual 100 hPa by 5° latitude bins as described in the text.

