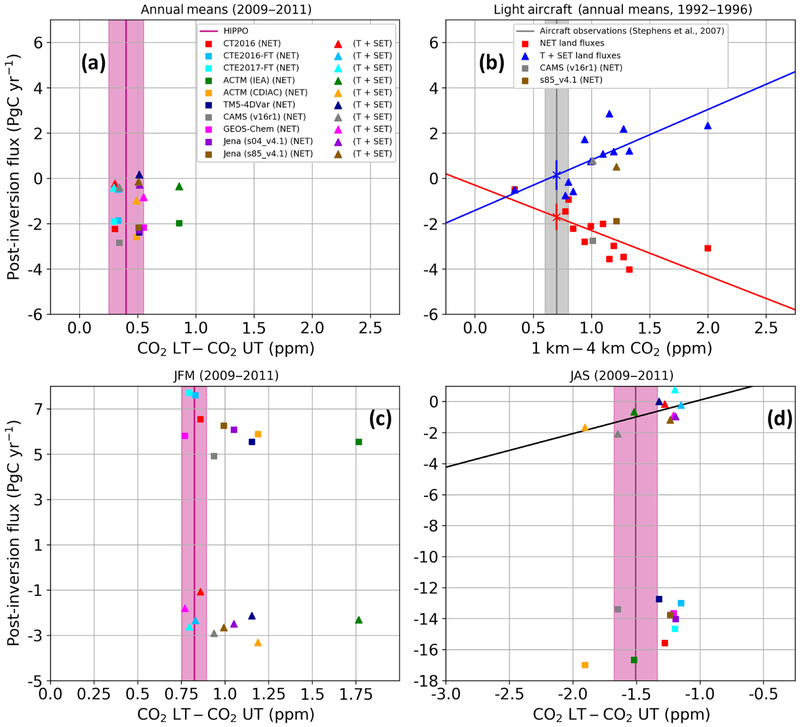
Figure 2.
Retrieved fluxes versus NET vertical gradients. (a) Annual mean NET land and T+SET land fluxes versus posterior NET vertical gradients (lower minus upper troposphere) from model output along HIPPO flight tracks and HIPPO observations (pink line) for the period 2009–2011. The shaded area represents an estimate of measurement uncertainty of ±0.15 ppm for the annual mean, as estimated in the Sect. S2 in the Supplement. Inverse model posterior concentration gradients and fluxes are shown as points (squares represent NET; triangles represent T+SET). The vertical axis represents the integrated annual mean land fluxes (PgC yr−1). (b) Same as (a) but for 1992–1996 and showing TransCom 3 Level 2 models and our two current models that span this time period, showing dependence of posterior fluxes on transport and a large range of transport biases. Annual mean NET (red squares) and T+SET (blue triangles) land carbon fluxes for 1992–1996 estimated by the 12 T3L2 models plotted as a function of the models’ post-inversion predicted mean vertical CO2 gradients at 10 light-aircraft profiling sites (adapted from Stephens et al., 2007) with fluxes partitioned by TransCom region. The Jena (s85_v4.1) and the CAMS (v16r1) simulations have also been sampled at the same light-aircraft locations but their fluxes are partitioned at 20° N and 20° S. The crosses show our new best estimate of the fluxes estimated by the regression of all T3L2 models. The error bars on these points are estimated using the standard error of the regressions. (c) Same as panel (a) for January–February–March (JFM), and (d) same as panel (a) for July–August–September (JAS). For the seasonal plots, the width of the pink bar is 0.07 ppm for JFM and 0.17 for JAS. In panel (d), the black line represents the regression line, shown because the relationship is statistically significant at a 95% confidence interval.

