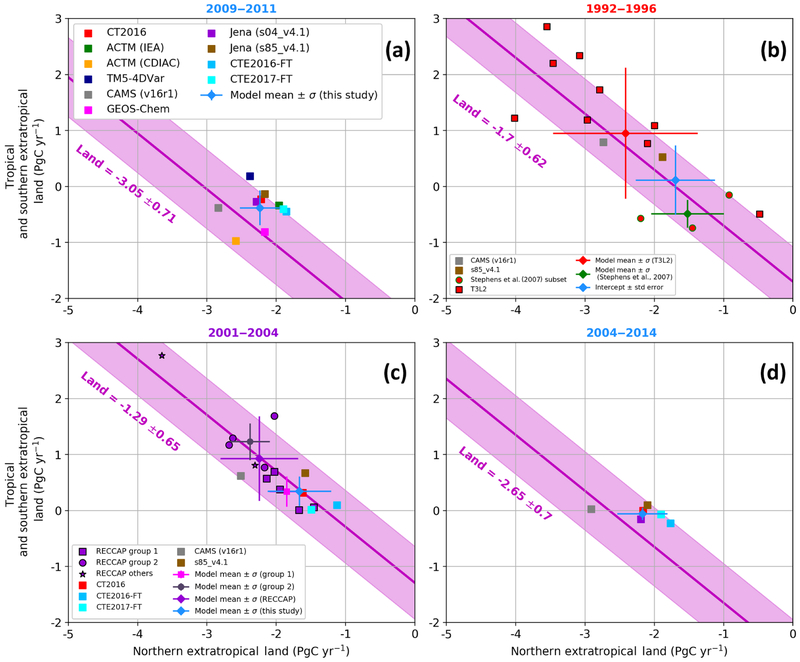
Figure 3.
Tropical and southern extratropical (T+SET) versus northern extratropical (NET) land fluxes for the periods (a) 2009–2011, (b) 1992–1996, (c) 2001–2004, and (d)2004–2014. The new models used in this study are represented by squares and the average of the available or selected simulations is shown in blue with 1 standard deviation error bars. The pink line and shaded area represents the GCP2016 (river adjusted) estimates of the total land sink for the given period. (a) Results for the HIPPO period 2009–2011; (b) results for the T3L2 period 1992–1996. The TransCom 3 Level 2 outputs (Gurney et al., 2004) are shown in red, with the vertical gradient selected models from Stephens et al. (2007) as circles outlined in green and the rest as red squares outlined in black. The intercept of the regression line with the observed vertical gradient (Fig. 2) is used to define our best flux estimate with error bars estimated by the standard error of the linear regression. (c) Results for the RECCAP period 2001–2004. Also, from Peylin et al. (2013), model means and standard deviations are shown in pink for the subgroup 1 (Jena, LSCEa, MACC-II, CTE2013, CT2011_oi) and in gray for the subgroup 2 (MATCH, CCAM, TrC, NICAM). Panel (d) shows the results from our new set of models for the period 2004–2014.

