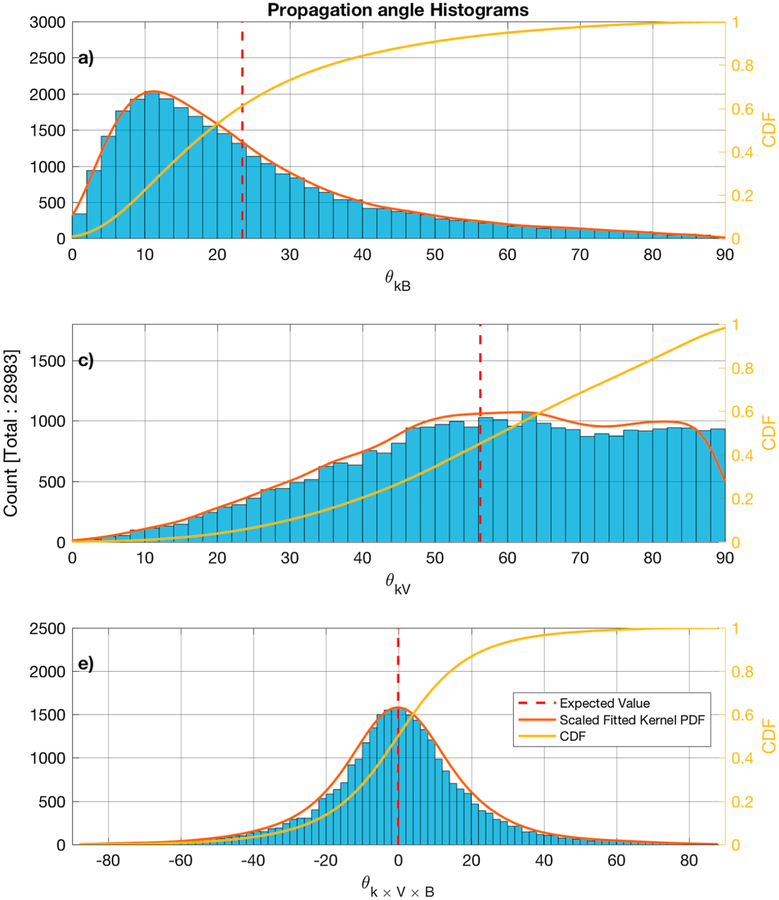
Figure 11.
Histograms of the propagation vector angle with the background magnetic field (panel a), the plasma bulk flow (panel b), and the latitude from the V × B plane (panel c) for the minimum variance analysis subintervals for which ωrf > ωLH. The estimated scaled fitted PDF and the CDF are also shown in red and yellow, respectively. The calculated average is shown by the dashed vertical red line. CDF = cumulative density function; PDF = probability density function.

