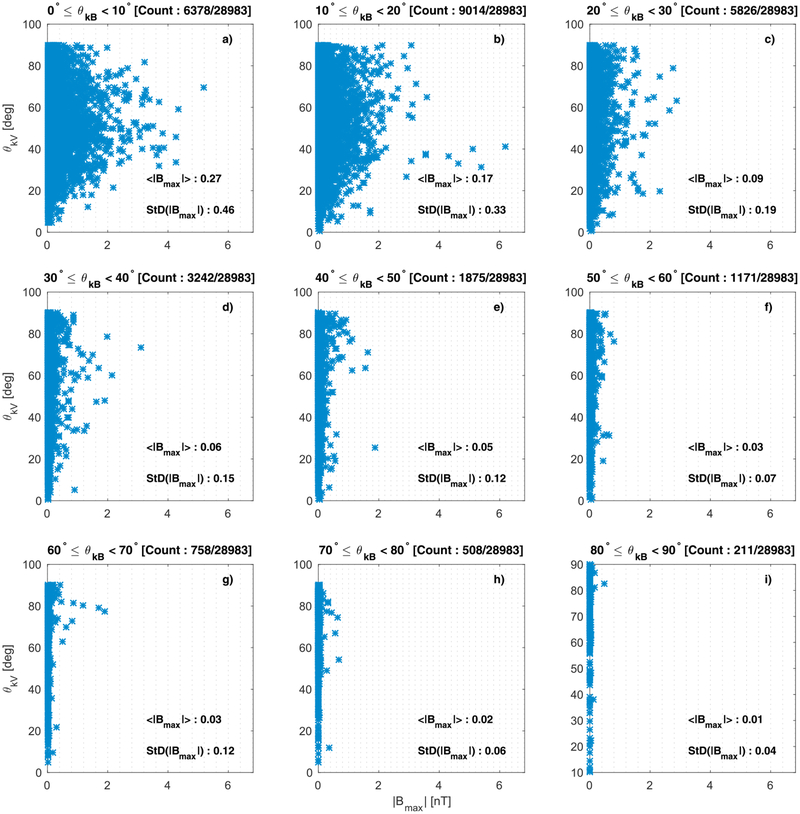
Figure 13.
(a-i) Plots of θkV against the amplitude in the maximum minimum variance analysis coordinate of the minimum variance analysis subintervals where ωrf > ωLH. In each panel emissions with the θkB range are shown. The mean (< |Bmax| >) and the standard deviation (StD(|Bmax|)) for each interval of θkB are also shown.

