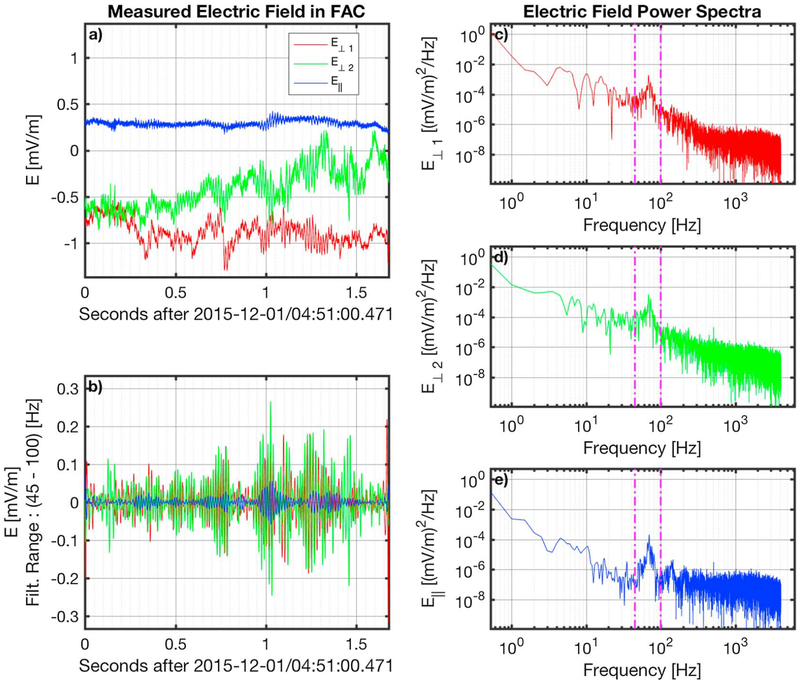
Figure 2.
Electric field measurements of an example lion roar. The measured electric field in FAC is shown in panel a. The band-pass ([45–100] Hz) filtered signal of the emission is shown in panel b. Panels c-e show the power spectrum for each of the three electric field components E⊥1, E⊥2, and E∥, respectively. The vertical magenta lines in panels c-e denote the frequency band of the emission as identified by the power spectra. FAC = field-aligned coordinates.

