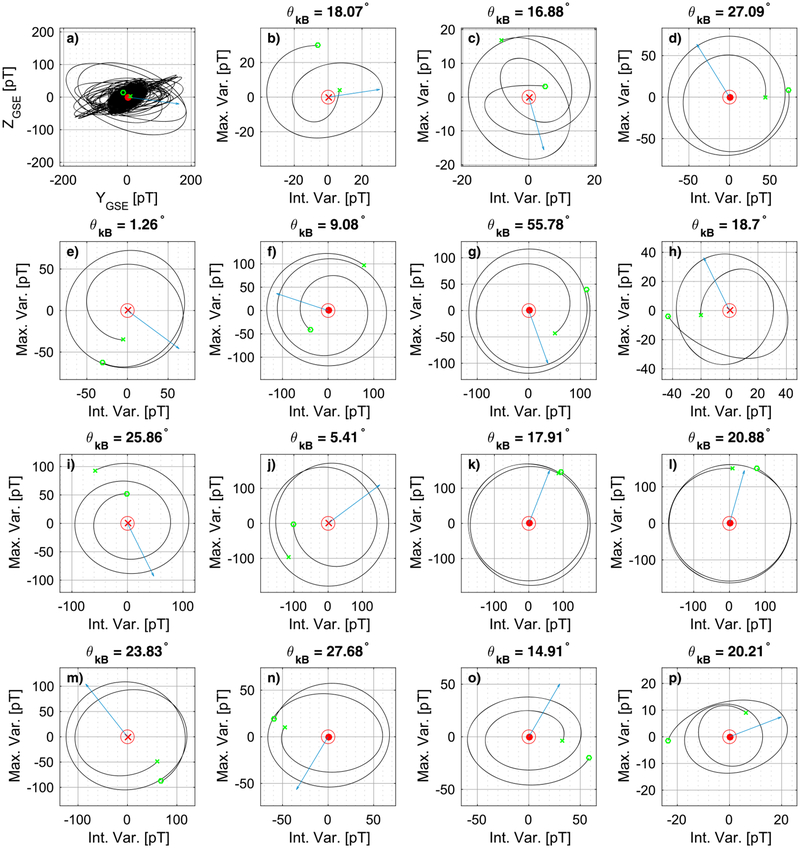
Figure 4.
(a-p) Hodograms of the magnetic field maximum and intermediate components for the individual minimum variance analysis intervals of the lion roar example. The blue arrow shows the direction of the background magnetic field (B0) projected onto the plane of the maximum and intermediate minimum variance analysis direction. The direction of the minimum variance is shown in the origin of the plots with a dot/cross mark.

