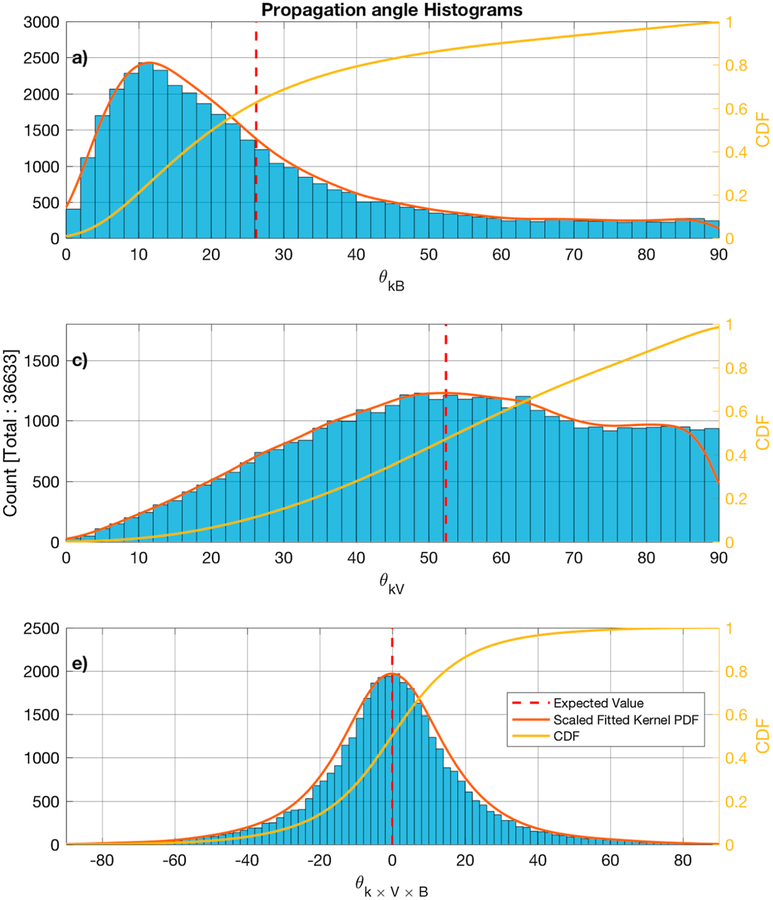
Figure 7.
Histograms of the propagation vector angle with the background magnetic field (panel a), the plasma bulk flow (panel b), and the latitude from the V × B plane (panel c). The estimated scaled fitted PDF and the CDF are also shown in red and yellow, respectively. The calculated average is shown by the dashed vertical red line. CDF = cumulative density function; PDF = probability density function.

