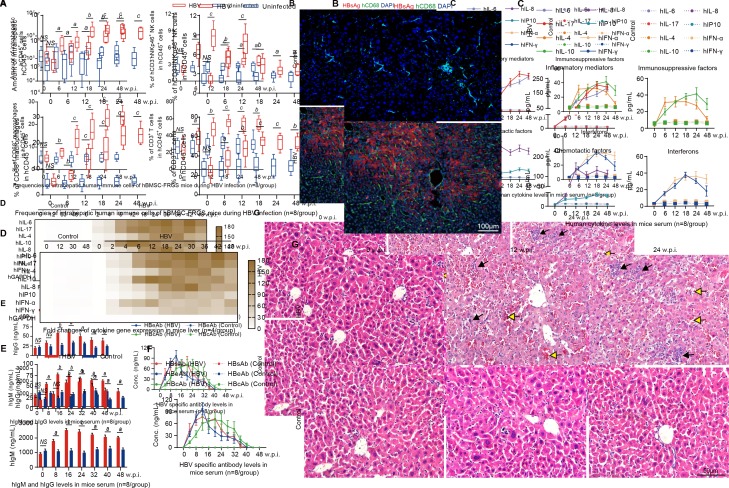
Figure 5.
Chronic HBV infection induced immune and inflammatory responses and chronic hepatitis in the human bone marrow mesenchymal stem cell-Fah-/- Rag2-/- IL-2Rγc-/- SCID (hBMSC-FRGS) mice. (A) Amount of hCD45+ cells (top left) and percentages of hCD45+hCD3-hNKp46+natural killer (NK) cells (top right), hCD45+hCD3-hCD68+ macrophages (bottom left) and hCD45+hCD3+ T cells (bottom right) in the livers of uninfected controls and HBV-infected hBMSC-FRGS mice from 0 to 48 weeks postinfection (w.p.i.) (n=8/group). (B) Liver sections from uninfected controls (top) and HBV-infected hBMSC-FRGS mice (bottom) at 24 w.p.i. were co-stained for hepatitis B surface antigen (HBsAg) (red) and hCD68 (green). 4′,6-diamidino-2-phenylindole (DAPI)-stained nuclei are shown in blue (bar=100 µm). (C) Plasma sample from uninfected controls and HBV-infected hBMSC-FRGS mice were analysed by ELISA for various human cytokines (n=8/group). (D) Quantitative reverse transcription PCR (qRT-PCR) analysis for the expression of human cytokine genes in HLA+ liver cells collected from uninfected controls and HBV-infected hBMSC-FRGS mice (n=4/group). (E) ELISA for the concentrations of hIgM and hIgG in sera of uninfected controls and HBV-infected hBMSC-FRGS mice (n=8/group). (F) ELISA for the concentrations of HBsAg antibody (HBsAb), HBeAg antibody (HBeAb) and HBcAg antibody (HBcAb) in sera of uninfected controls and HBV-infected hBMSC-FRGS mice (n=8/group). (G) H&E staining of liver tissues collected from uninfected controls and HBV-infected hBMSC-FRGS mice. The yellow arrow indicates the haemorrhage point, and the black arrow indicates the recruitment and infiltration of immune cells (bar=50 µm). a) P<0.05; b) p<0.01; c) p<0.001). NS, not significant.

