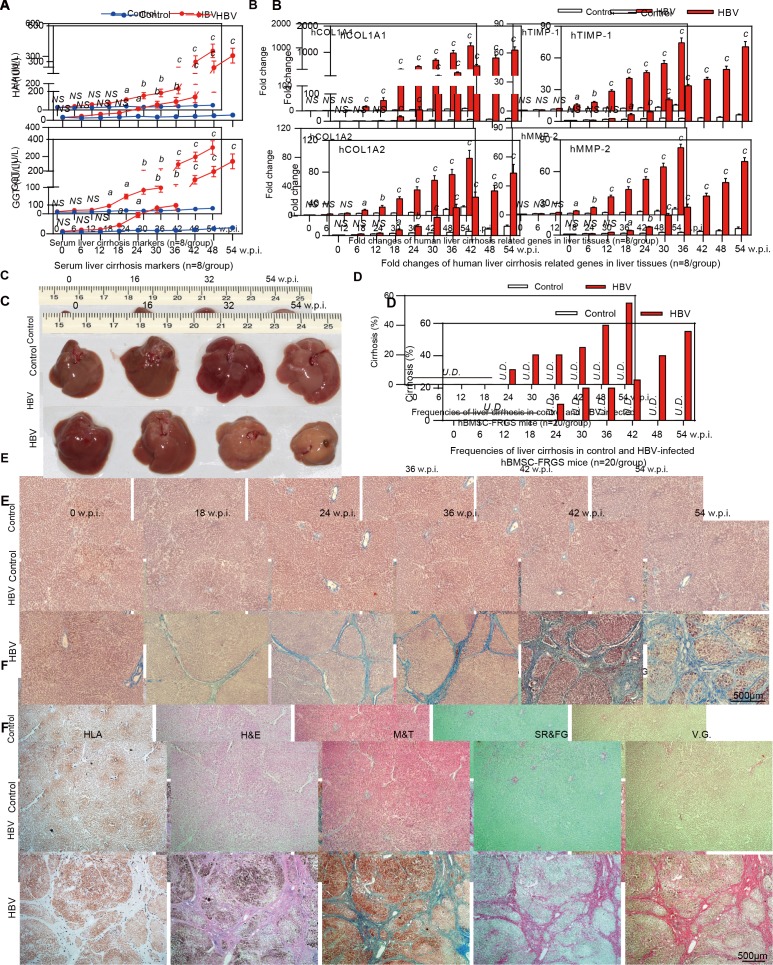
Figure 6.
Progression of chronic HBV infection induced liver cirrhosis. (A) Concentration of the liver cirrhosis markers hyaluronic acid (HA) and gamma glutamate transpeptidase (GGT) in serum of uninfected controls (blue line) and HBV-infected human bone marrow mesenchymal stem cell-Fah-/- Rag2-/- IL-2Rγc-/- SCID (hBMSC-FRGS) mice (red line) (n=8/group). (B) quantitative reverse transcription PCR (qRT-PCR) analysis of the expression of four human cirrhosis-related genes in liver tissues collected from uninfected controls (white column) and HBV-infected hBMSC-FRGS mice (red column) (n=8/group). (C) Morphology of liver cirrhosis and (D) statistical analysis of related morbidity in uninfected controls (white column) and HBV-infected hBMSC-FRGS mice (red column) during a 54-week HBV infection course (n=20/group). (E) M&T staining of liver tissues collected from uninfected controls and HBV-infected hBMSC-FRGS mice during the progression of HBV-induced liver cirrhosis (bar=500 µm). (F) Immunohistochemistry (IHC) staining for human leucocyte antigen (HLA) and pathological staining (H&E, M&T, SR/FG and VG) of serial sections collected from uninfected controls and HBV-infected hBMSC-FRGS mice with typical liver cirrhosis (bar=500 µm). a) P<0.05; b) p<0.01; c) p<0.001. NS, not significant; U.D., undetectabl; w.p.i., weeks postinfection.

