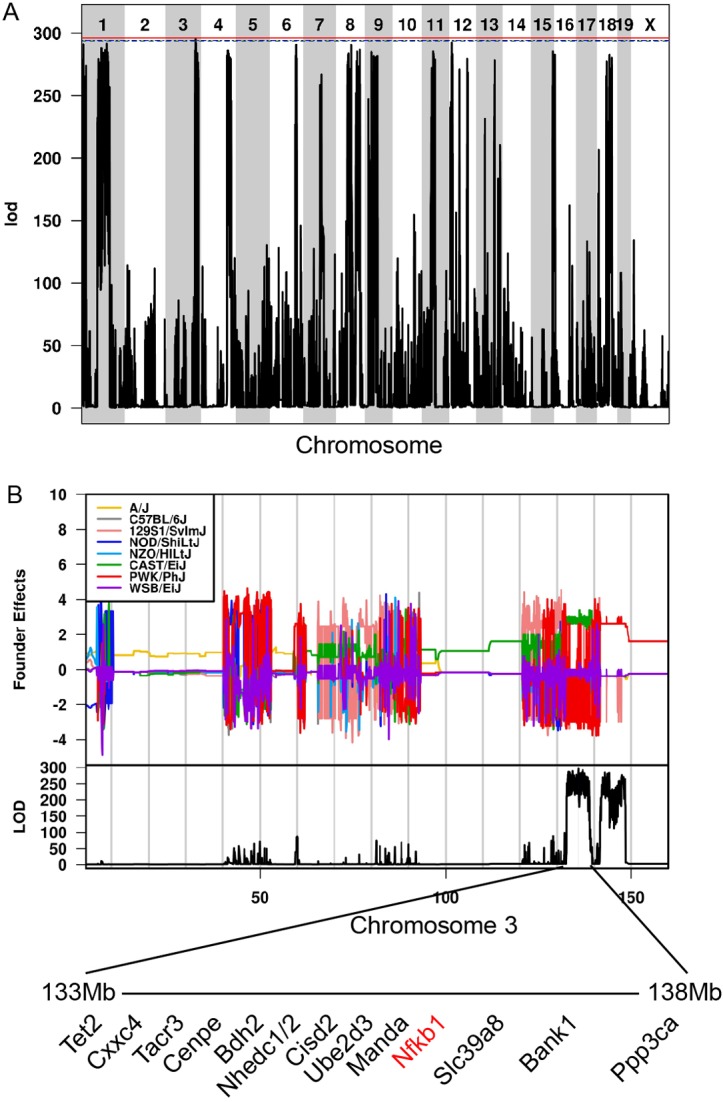
Figure 3.

Identification of genetic loci associated with gastric cancer susceptibility in CC036. (A) Genome-wide association plot of CC036 gastric cancer susceptibility. Chromosomal position of mouse SNPs is shown on the x-axis. The logarithm of the odds (to the base 10) (lod) score of the association for each SNP is shown on the y-axis. (B) Founder haplotype contributions to gastric cancer susceptibility on chromosome 3. Candidate genes are listed below.
