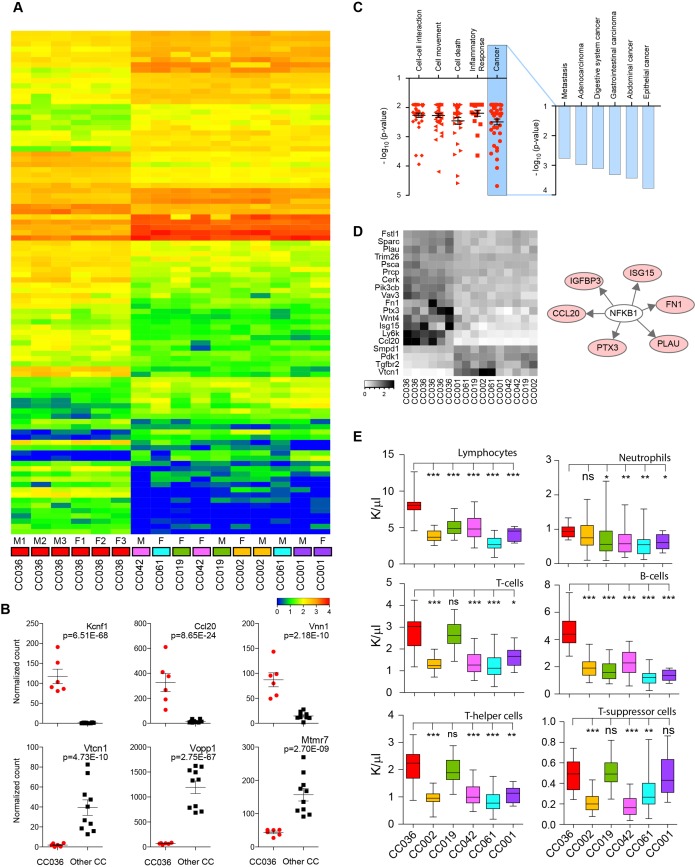
Figure 4.
RNA sequencing and immune analysis in CC036 and five control CC strains. (A) Heatmap of differentially expressed genes in gastric tissue between CC036 and control CC strains (fold-change 1.5 and adjusted p<0.05). Red indicates higher expression and blue indicates lower expression. (B) Box plots of normalised sequence read counts for six genes significantly differentially expressed between CC036 and control CC strains. (C) Functional enrichment analysis of genes differentially expressed between CC036 and control CC strains using Ingenuity Pathway Analysis (IPA) (left panel). Detailed functional enrichment for cancer types and related phenotypes (right panel). (D) Heatmap of inflammatory-response gene signature in gastric tissue of CC036 and control CC strains. Black indicates higher expression, and white indicates lower expression. (E) Distribution of circulating lymphocytes, B cells (CD45R/B220), total T cells (CD3+), neutrophils, T-helper cells (CD3+/CD4+) and T-suppressor cells (CD3+/CD8+) in blood from CC036 and control CC strains. Error bars represent minimum and maximum values; the median is indicated with a horizontal bar inside each box. ***P<0.001, **p<0.01, *p<0.05; ns is not significant. P was obtained using non-parametric Mann-Whitney test. CC, Collaborative Cross.

