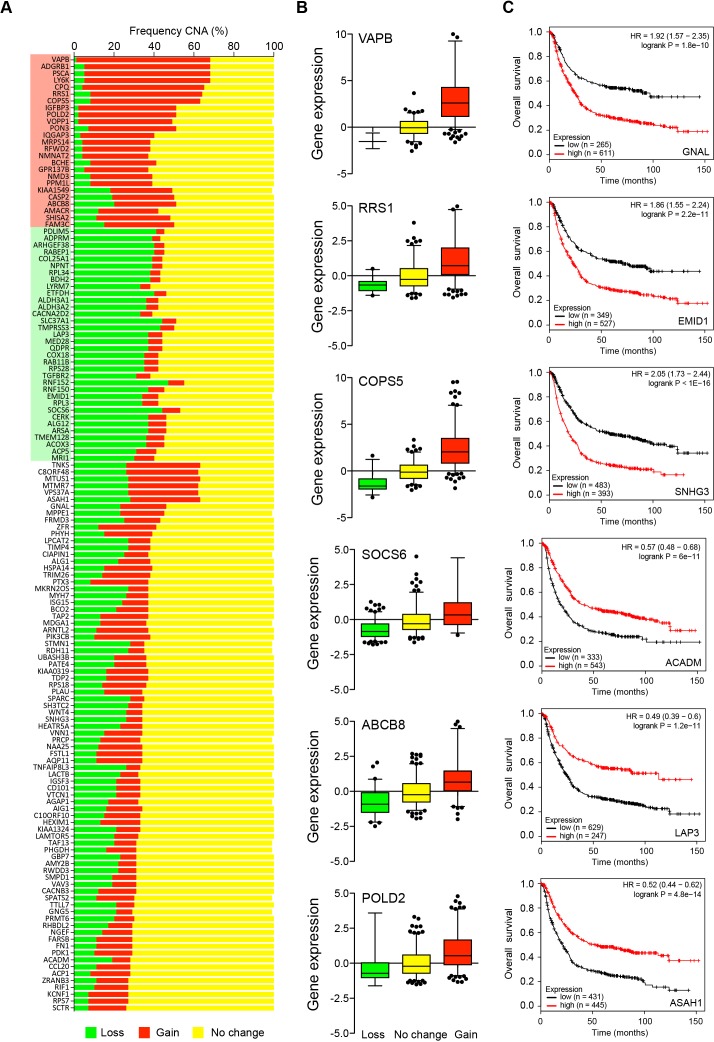
Figure 5.
Evaluation of differentially expressed genes identified between CC036 and control strains in human gastric adenocarcinoma. (A) Frequency of copy number aberrations (CNAs) of human orthologues of differentially expressed mouse genes in human gastric cancers (TCGA). Red indicates increased DNA copy number (gain), green indicates decreased DNA copy number (loss) and yellow indicates no change. Red and green highlights of gene names indicate genes that are frequently gained and lost in human gastric cancer, respectively. (B) Representative box plots of the association between gene expression and CNA in human gastric cancers (TCGA). Red indicates increased DNA copy number (gain), green indicates decreased DNA copy number (loss) and yellow indicates no change. (C) Representative Kaplan-Meier plots for the association of gene expression with overall survival. Red indicates tumours with high transcript expression of the corresponding gene and black indicates low expression. Kaplan-Meier plots were obtained using a meta-analysis of 882 gastric cancer patients with a mean follow-up of 33 months available from Kaplan-Meier plotter. The p value represents the equality of survival curves based on a log-rank test. TCGA, The Cancer Genome Atlas.

