Figure 7.
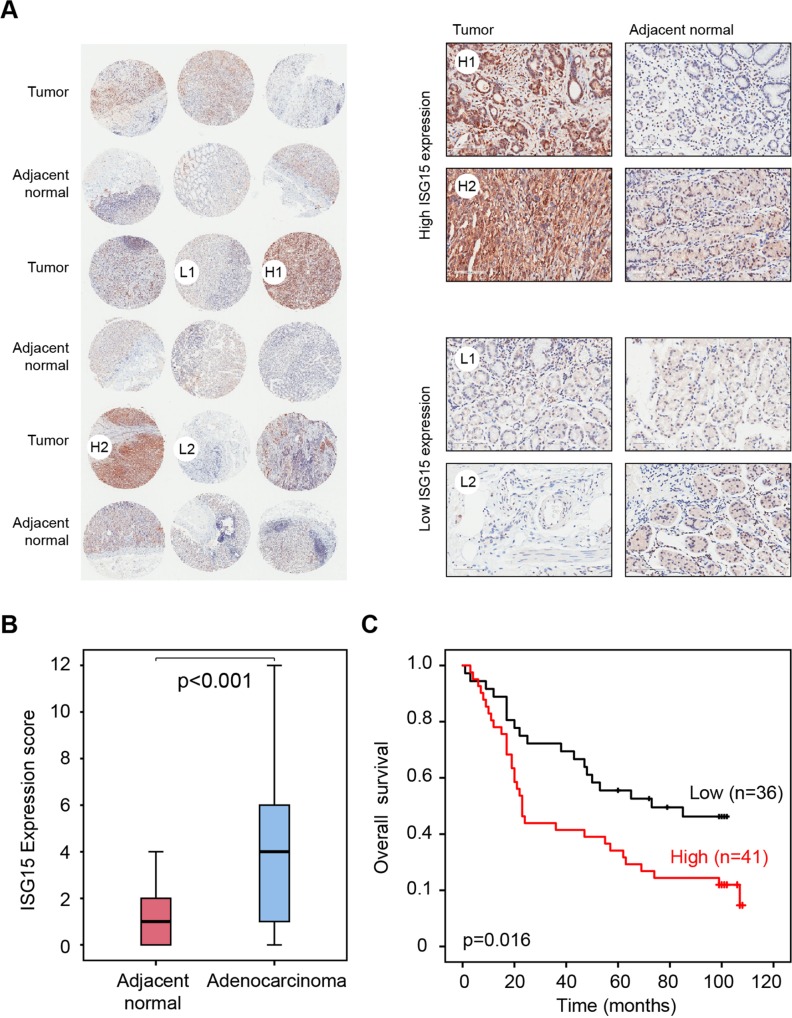
ISG15 protein expression is increased in stomach adenocarcinoma and associated with poor prognosis. (A) Representative images of IHC staining of tissue microarray containing gastric cancer and adjacent normal tissue. Representative tumours with high expression are labelled H1 and H2 and tumours with low expression are labelled L1 and L2. (B) Box plot of ISG15 protein expression score in adenocarcinoma and adjacent normal tissue (p<0.001 obtained using Mann-Whitney test). (C) Association of ISG15 protein expression with overall survival. Red indicates tumours with a high ISG15 expression (score >3), and black indicates low expression (score ≤3). The p value represents the equality of survival curves based on a log-rank test.

