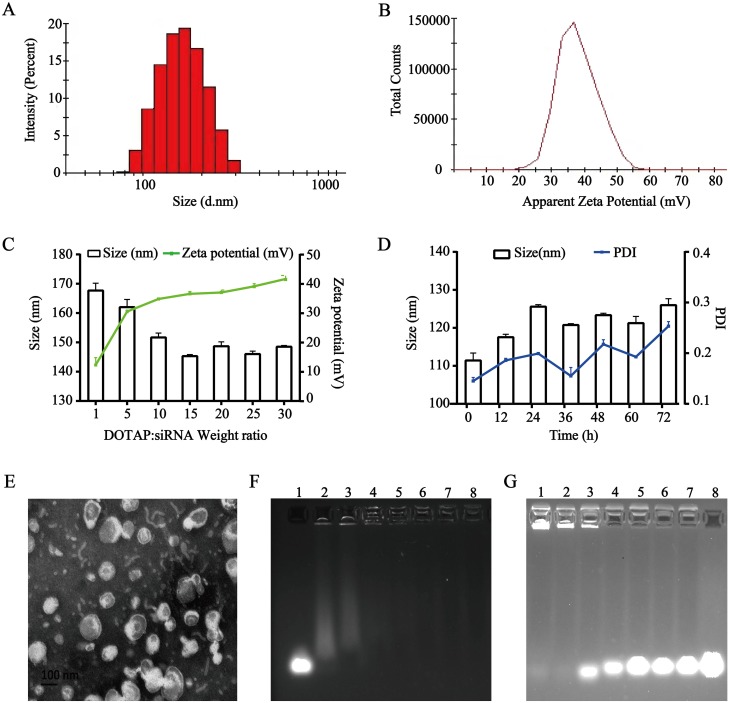
Figure 2.
Characterization of the TAT-CLs-DHA/siRNA nanocomplexes. (A) Particle size distribution. (B) Zeta potential. (C) Size distribution and zeta potential of the TAT-CLs-DHA/siRNA at different DOTAP:siRNA ratios. (D) Particle size stability of TAT-CLs-DHA/siRNA in serum within 72h. (E) TEM image. (F) The agarose gel electrophoresis image illustrating siRNA loading efficiency at the following weight ratio of DOTAP:siRNA (w/w): 0:1 (siRNA only, control), 5:1, 10:1, 15:1, 20:1, 25:1, 30:1, 40:1 (lanes 1–8, respectively). (G) siRNA serum stability: 60h, 48h, 36h, 24h, 12h, 6h, 3h, siRNA only (lanes 1–8, respectively). Data represent mean ± SD (n = 4).

