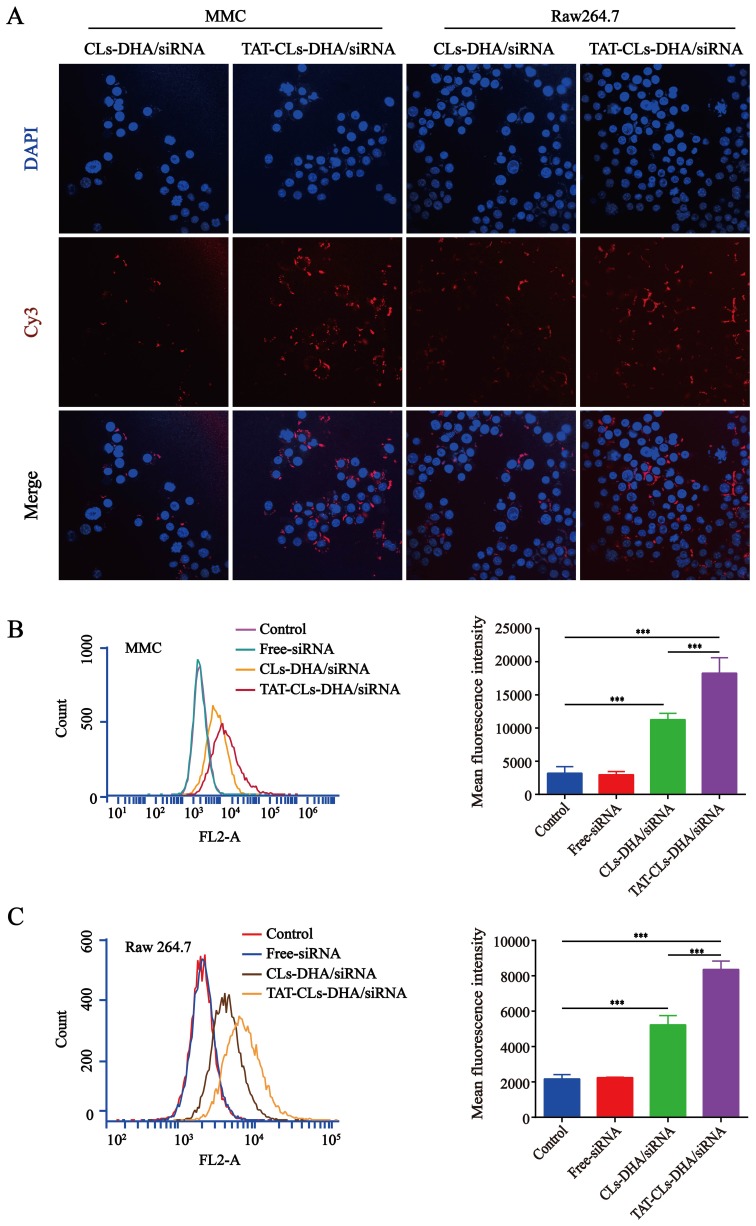
Figure 5.
In vitro cellular uptake of different formulations, including TAT-CLs-DHA/Cy3-siRNA and CLs-DHA/Cy3-siRNA liposomes, conducted in MMC cell and RAW264.7 cells for 4h. The concentration of Cy3 was 100nM. (A) Intracellular localization by CLSM. (B, C) Typical flow cytometry profiles. Data represent mean ± SD (n >5). ***p < 0.001.

