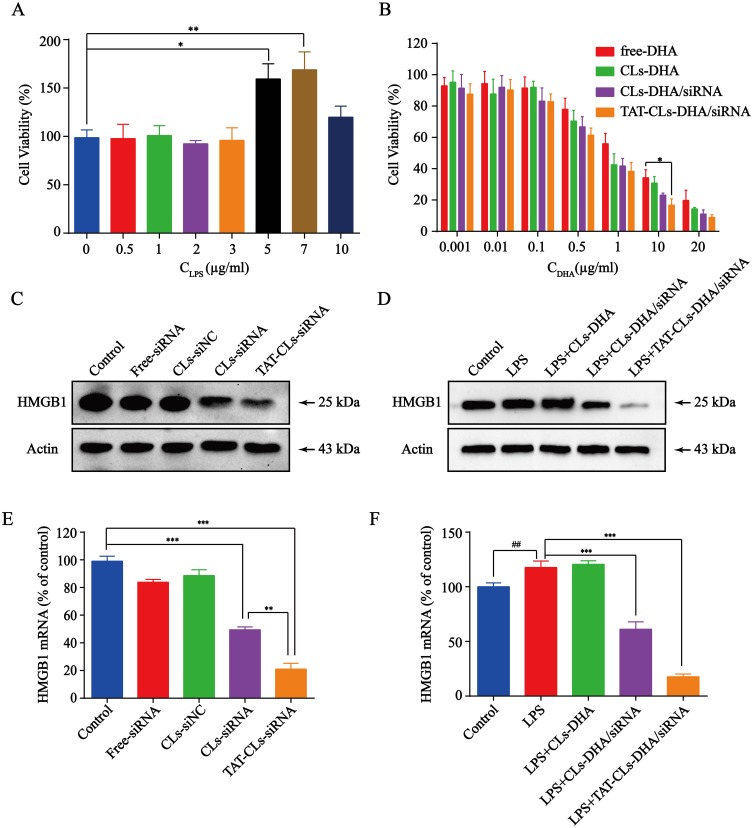
Figure 6.
The effects of different formulations, including DHA, CLs-DHA, CLs-DHA/siRNA and TAT-CLs-DHA/siRNA liposomes on MMC cells proliferation following LPS treatment. (A) Different concentrations of LPS stimulate the proliferation of MMC cells. (B) Liposomes inhibit LPS-induced MMC cell proliferation analyzed by MTT assay. (C) Western blotting of HMGB1 expression in the MMC cells after treated with HMGB1 siRNA liposomes. (D) Effects of different formulations on LPS-induced HMGB1 expression in MMC cells detected by Western blot. (E) qRT-PCR quantitative analysis of the expression of HMGB1 in mRNA level after treated with HMGB1 siRNA liposomes. (F) qRT-PCR quantitative analysis of the expression of HMGB1 in mRNA level after treated with different formulations. Data represent mean ± SD (n >5). ***p < 0.001, **p < 0.01 and *p < 0.05. ##p < 0.01 compared to control group.

