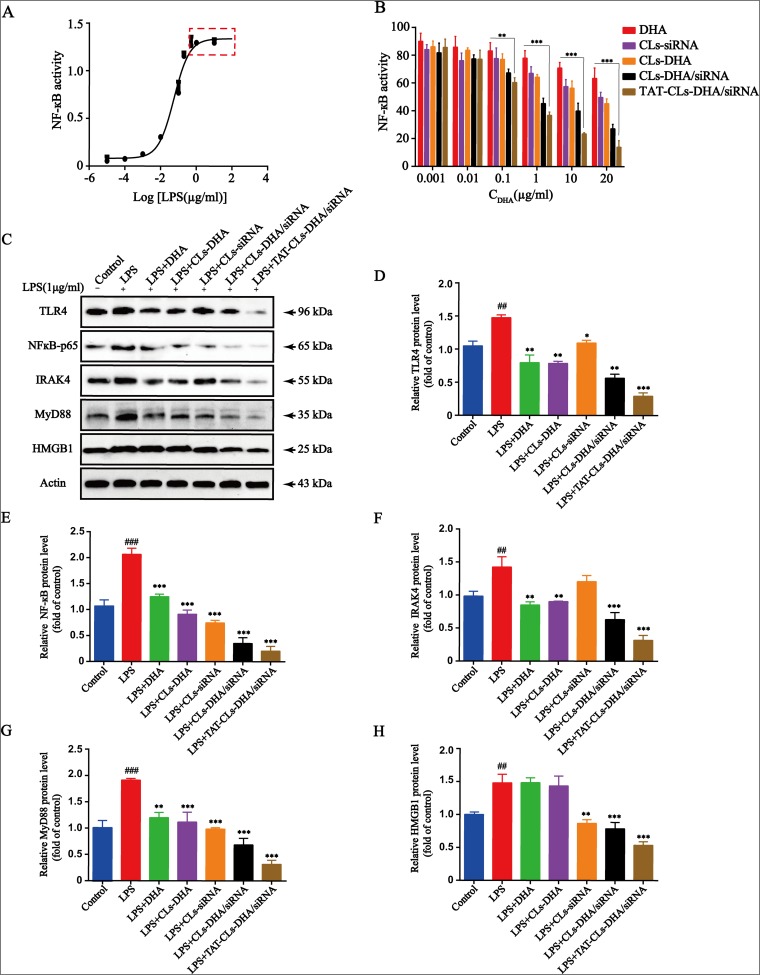
Figure 8.
Effects of different formulations, including DHA, CLs-siRNA, CLs-DHA, CLs-DHA/siRNA and TAT-CLs-DHA/siRNA liposomes on LPS-induced TLR4 signalling. (A) Different concentrations of LPS activate TLR4 signaling pathway in HEK-BlueTM-hTLR4 cells. (B) Liposomes inhibite LPS-induced TLR4 activation in HEK-BlueTM-hTLR4 cells. (C) TLR4, NF-κB p65, IRAK4, MyD88 and HMGB1 protein expression in RAW264.7 cells detected by Western blot. Quantitative analysis of Western blotting bands including (D) TLR4, (E) NF-κB p65, (F) IRAK4, (G) MyD88, (H) HMGB1. Data represent mean ± SD (n >5). ***p < 0.001, **p < 0.01, *p < 0.05 compared to LPS group. p < 0.001, ###p<0.001 ##p < 0.01, compared to control group.

