
Figure 2.
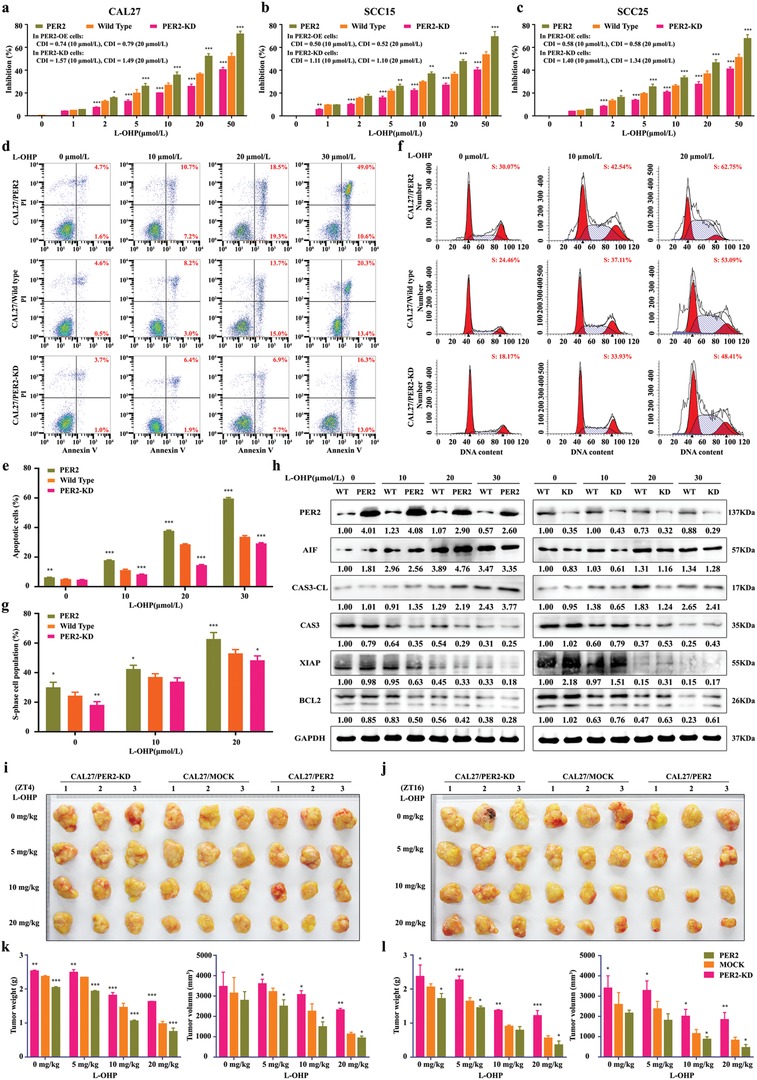
PER2 strengthens the cytotoxicity of oxaliplatin in human OSCC. a–c) Dose‐dependent growth inhibition in response to oxaliplatin (L‐OHP) treatment in PER2 overexpression or PER2‐knockdown CAL27, SCC15, and SCC25 cells (n = 5 independent experiments). Wild‐type cells were used as control. CDI was the coefficient of drug interaction. d,e) Cell apoptosis was evaluated by flow cytometry of CAL27/PER2 and CAL27/PER2‐knockdown (KD) cells stained with Annexin V and PI after treatment with oxaliplatin (0, 10, 20, or 30 µmol L−1, 48 h) (n = 3 independent experiments). f,g) Cell‐cycle phases were determined by flow cytometry of CAL27/PER2 and CAL27/PER2‐KD cells after treatment with oxaliplatin (0, 10, or 20 µmol L−1, 48 h) (n = 3 independent experiments). h) Western blot and densitometric quantification of the indicated proteins in CAL27/PER2 and CAL27/PER2‐KD cells treated with 0, 10, 20, or 30 µmol L−1 oxaliplatin (n = 3 independent experiments). GAPDH was used as the loading control. i,j) Representative images of xenografts formed after oxaliplatin treatment. CAL27/PER2 and CAL27/PER2‐KD cells were subcutaneously injected into mice. Mock was used as the control. g,h) Two weeks after cell inoculation, mice were treated with 0, 5, 10, or 20 mg kg−1 oxaliplatin (twice a week) for four weeks at ZT4 or ZT16. k,l) Tumor weights and volumes at the endpoint of mice (n = 3 animals per group). *P < 0.05, **P < 0.01, and ***P < 0.001 (compared with wild type or mock). ANOVA was used. Data represent the mean ± SD.