
Figure 5.
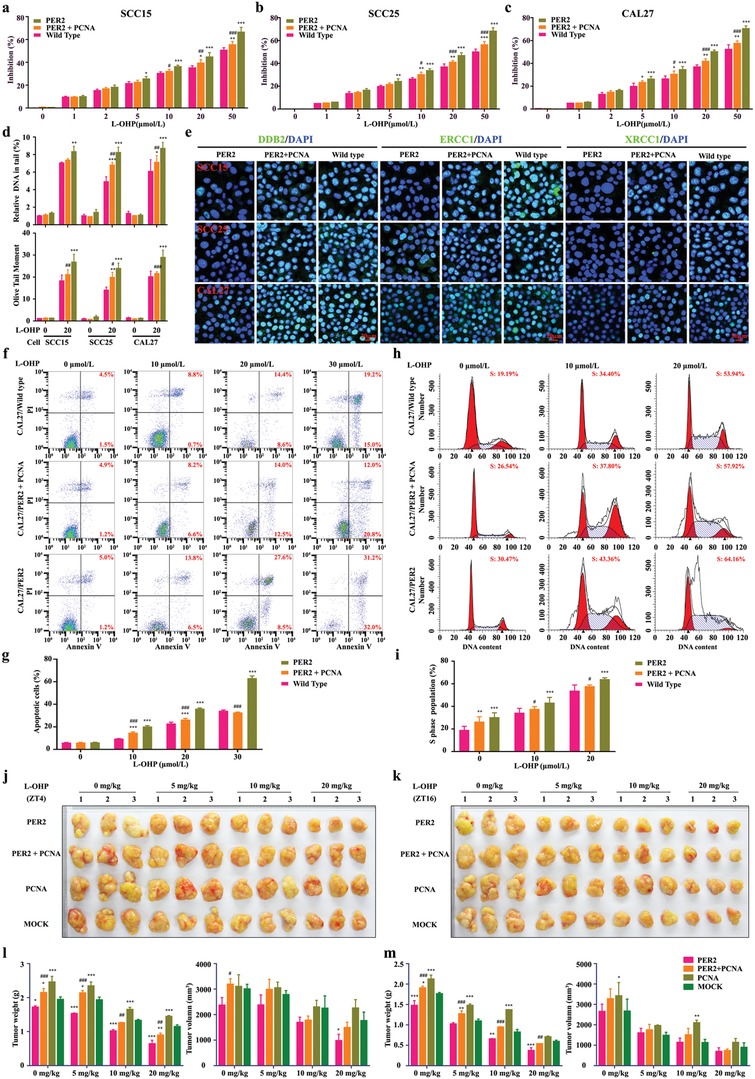
PCNA is negatively correlated with PER2 in oxaliplatin sensitivity modulation. a–c) Dose‐dependent growth inhibition in response to oxaliplatin (20 µmol L−1) in PER2‐overexpressing or PER2/PCNA double‐overexpressing SCC15, SCC25, or CAL27 cells (n = 5 independent experiments). d) Comet assay breaks. DNA strand breaks of globally oxaliplatin‐treated (30 µmol L−1, 48 h). Breaks were quantified as % tail DNA (upper) and olive tail moment (lower). At least 50 cells were analyzed per sample. e) Representative confocal images of DDB2, ERCC1, and XRCC1 in PER2‐overexpressing or PER2/PCNA double‐overexpressing OSCC cells (n = 3 independent experiments). Scale bar, 20 µm. f,g) Apoptosis was evaluated by flow cytometry of CAL27/PER2 and CAL27/PER2+PCNA cells after treatment with oxaliplatin (0, 10, 20, or 30 µmol L−1, 48 h), cell stained with Annexin V and PI (n = 3 independent experiments). h,i) Cell‐cycle phases were determined by flow cytometry of CAL27/PER2 and CAL27/PER2+PCNA cells after treatment with oxaliplatin (0, 10, or 20 µmol L−1, 48 h) (n = 3 independent experiments). j,k) Representative images of xenografts formed after oxaliplatin treatment. CAL27/PER2, CAL27/PER2+PCNA, or CAL27/PCNA cells were subcutaneously injected into mice. Two weeks after cell inoculation, mice were treated with 0, 5, 10, or 20 mg kg−1 oxaliplatin (twice a week) for four weeks at ZT4 (j) or ZT16 (k) (n = 3 animals per group). l,m) Tumor weights and volumes at the endpoint of mice. *P < 0.05, **P < 0.01, and ***P < 0.001 (compared with wild type or Mock), # P < 0.05, ## P < 0.01, and ### P < 0.001 (compared with PER2), from ANOVA. Data represent the mean ± SD.