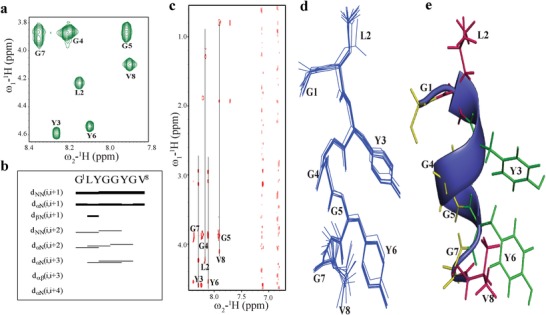
Figure 3.

Solution NMR characterization of GV8 at monomeric concentration (0.5 × 10⁻³ m). a) 2D 1H–1H TOCSY spectrum of 0.5 × 10⁻³ m GV8 peptide delineating the individual spins of GV8 amino acid residues. b) Bar diagram representation of NOE connectivities detected for GV8 peptide. c) 2D 1H–1H NOESY spectra displaying weak ring interaction of Y3 and Y6. d) Superimposition of ten lowest energy structures of GV8 peptide. e) Representative structure of monomeric 310‐helix showing side chain stacking of Y3 and Y6.
