
Figure 5:
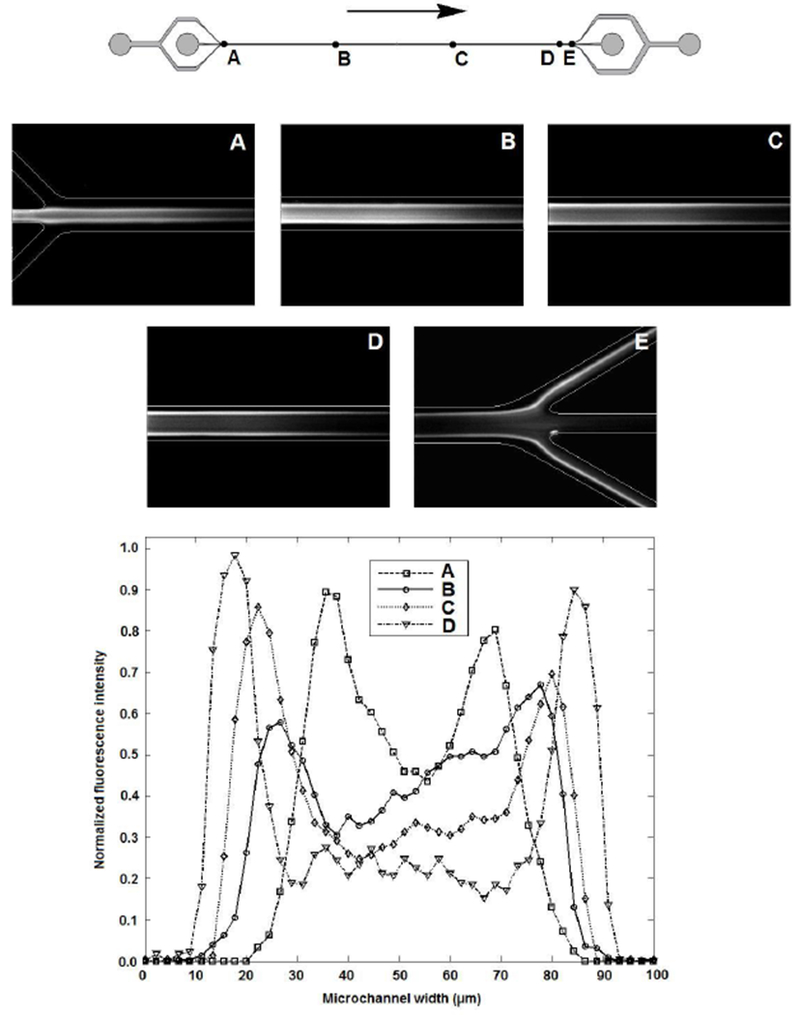
Composite images show lateral distribution of 10.2 μm diameter microspheres at five different axial locations as indicated in the drawing of the channel. Grayscale line scans (normalized) of composite images A through D are shown in the graph. Rc = 42.