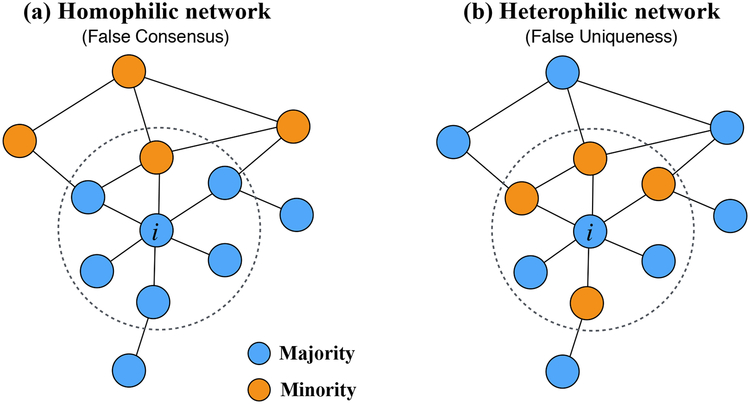
Fig. 1. Individual- and group-level social perception bias.
Individuals belong to one of two groups: the majority (blue) or the minority (orange). The minority fraction is 1/3 in both networks (fa ≈ 0.33). Panel (a) depicts a homophilic network and panel (b) shows a heterophilic network. We can study social perception biases originating on the individual and the group level. On the individual level, individual i perceives the size of the minority group in the overall network based on his personal network, denoted by dashed circles. In the homophilic network, i perceives the size of the minority to be approximately 1/6 ≈ 16%, while in the heterophilic network i perceives the size of the minority to be approximately 4/6 ≈ 67%. Therefore, in the homophilic network, individual i underestimates the minority-group size by a factor of 0.5 and in the heterophilic network i overestimates the minority size by a factor of 2. On the group level, the majority group perceives the size of the minority group to be 4/18 ≈ 20% in the homophilic network and 10/18 ≈ 56% in the heterophilic network. The majority group underestimates the size of the minority group by a factor of 0.6 in the homophilic network and overestimates the minority-group size by a factor of 1.67 in the heterophilic network. In sum, depending on the topological structure of the network, individuals’ and groups’ perceptions about their own and other groups’ sizes can be distorted.

