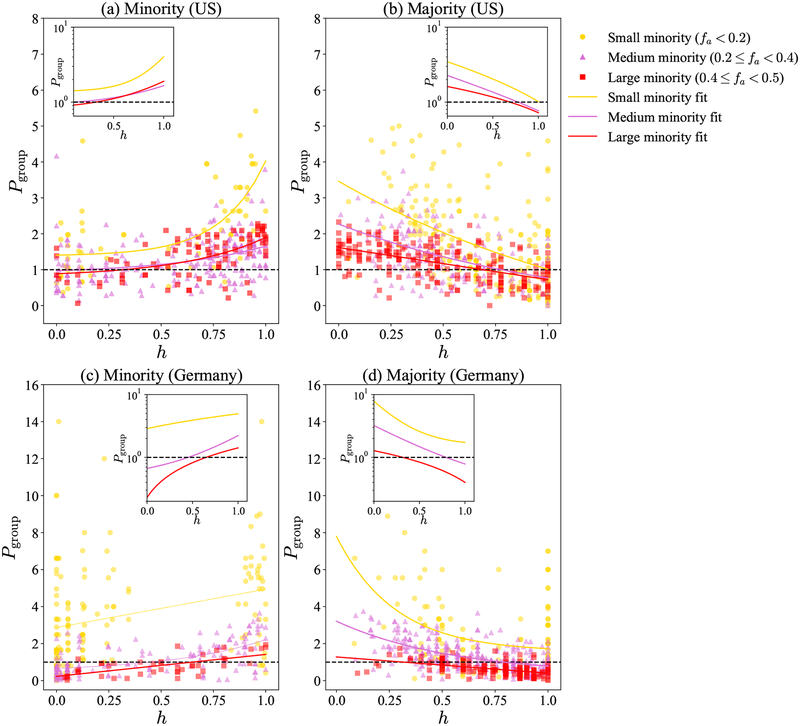
Fig. 2. Bias in perception of minority-group size, for participants whose personal networks exhibit different levels of homophily (h), and for attributes held by a small, medium, or large minority group in a given country.
Rows shows results from different countries: United States (top) and Germany (bottom). Different colors distinguish perception biases for attributes that in a given country are held by a small (fa < 0.2), medium (0.2 ≤ fa < 0.4), or large (0.4 ≤ fa < 0.5) minority group. Each data point represents the perception bias of a group where one individual involved for an attribute. Group level perception bias is calculated as a ratio of the perceived size of the minority group (obtained in our surveys) and the objective minority size (obtained from national surveys). Panels in the left column show perception biases of the minority, and panels in the right column show perception biases of the majority. The solid line is the curve fit of the data. The insets show fitted trends on a log scale to make the amount of underestimation and overestimation comparable. Homophily (h) is estimated from participants’ reports about the minority-group fraction in their personal networks by mean-field assumption (see Supplementary Materials).

