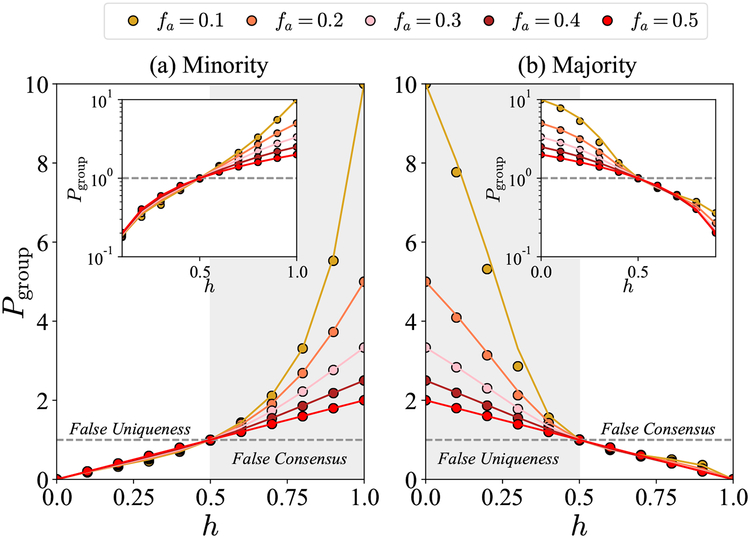
Fig. 3. Estimation of minority group size by (a) the minority group and (b) the majority group, as a function of homophily of personal networks (h) and the minority-fraction (fa) in the overall network.
Different colors refer to networks with different minority fractions (fa). The analytic results are displayed as solid lines and numerical results as circles. In the heterophilic networks (0 ≤ h < 0.5), the minority (a) underestimates its own size, and the majority (b) overestimates the size of the minority, resembling false uniqueness. In homophilic networks (0.5 < h ≤ 1), the minority (a) overestimates its own size and the majority (b) underestimates the size of the minority, resembling false consensus. The insets show the same information on a log scale to make the amount of underestimation and overestimation comparable.

