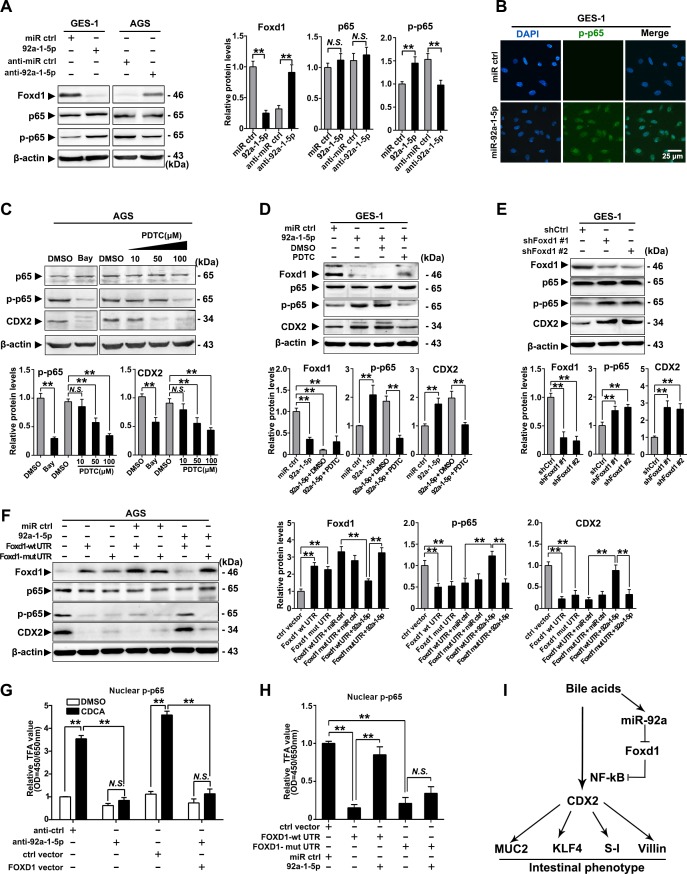
Figure 5.
miR-92a-1–5p regulates CDX2 expression through a FOXD1-nuclear factor kappa B (NF-κB) pathway. (A) Left: the levels of FOXD1, p65 and phosphor-p65 (p-p65) were analysed by western blot analysis in gastric epithelial cell line (GES)-1 and AGS cells with transfection of miR-92a-1–5p mimics and inhibitors, respectively. Right: quantification of western blot analysis results were normalised as to β-actin (p-p65 quantification was normalised as to p65). (B) Immunofluorescence showed p-p65 expression in the nuclei of GES-1 cells with upregulation of miR-92a-1–5p. (C) Top: western blot analysis showed expression of CDX2 was decreased by inhibition of p65 phosphorylation on Bay (1 µM, 1 hour) or PDTC (10–100 µM, 1 hour) treatment. Bottom: quantification of western blot analysis results normalised as in figure 6A. (D) Top: western blot analysis showed expression of CDX2 in GES-1 cells with restoration of miR-92a-1–5p together with pyrrolidinedithiocarbamic acid (PDTC) or dimethyl sulphoxide (DMSO). Bottom: quantification of western blot analysis results normalised as in figure 5A. (E) Top: western blot analysis showed knockdown of FOXD1 by short hairpin RNA (shRNA) led to increase of phosphorylation of p65 and consequential upregulation of CDX2. Bottom: quantification of western blot analysis results normalised as in figure 5A. (F) Left: AGS cells were infected with FOXD1-expressing vectors, along with miR-92a-1–5p. FOXD1, p65, p-p65 and CDX2 expression were detected by immunoblot. Right: quantification of western blot analysis results normalised as in figure 5A. β-Actin levels were used as internal control in all immunoblotting assays. (G) GES-1 cells were infected with FOXD1-expressing vectors, along with miR-92a-1–5p and treated with CDCA for 24 hours at 100 µM. Nuclear protein were extracted and p-p65 were examined by EZ-TFA assay. (H) AGS cells were treated as in figure 5F and p-p65 were examined by EZ-TFA assay. Means±SEM of a representative experiment (n=3) performed in triplicates are shown. *P<0.05; **p<0.01. (I) The schematic model demonstrating the sequential regulation of miR-92a, FOXD1, NF-κB and CDX2 in gastric cells on bile acids stimulation. N.S., not significant.

