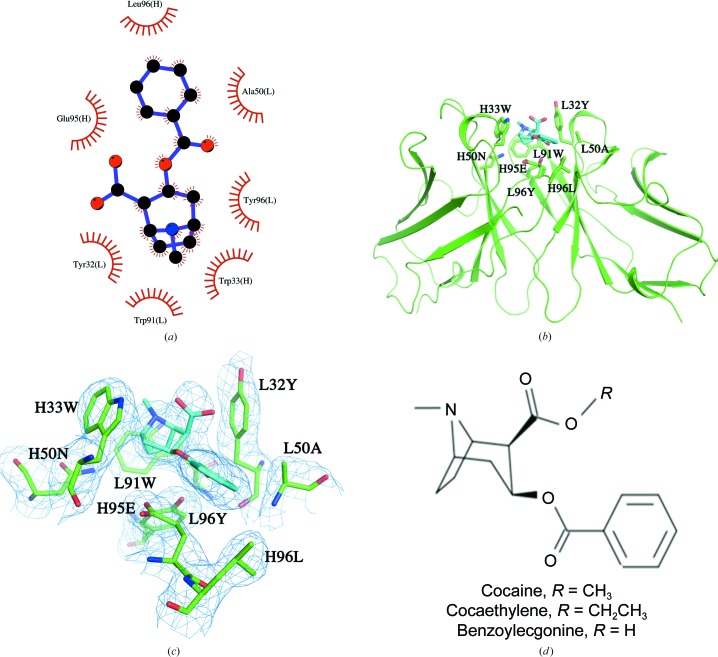
Figure 2.
(a) A schematic view of the interactions of benzoylecgonine and h2E2 Fab generated by LigPlot+ (Laskowski & Swindells, 2011 ▸). (b) A view of the complex structure showing the binding-site interactions between benzoylecgonine (C atoms in cyan) and the variable-region residues of the h2E2 Fab (C atoms in green). The ligand and the binding residues from the Fab are shown as stick drawings, whereas the VL and VH domains are shown as a Cα carton in green. (c) A view of the electron density observed in a 2mF o − DF c OMIT map is shown for benzoylecgonine and the surrounding residues contoured at 1σ. (d) Chemical representation of cocaine and its analogs benzoylecgonine and cocaethylene.

