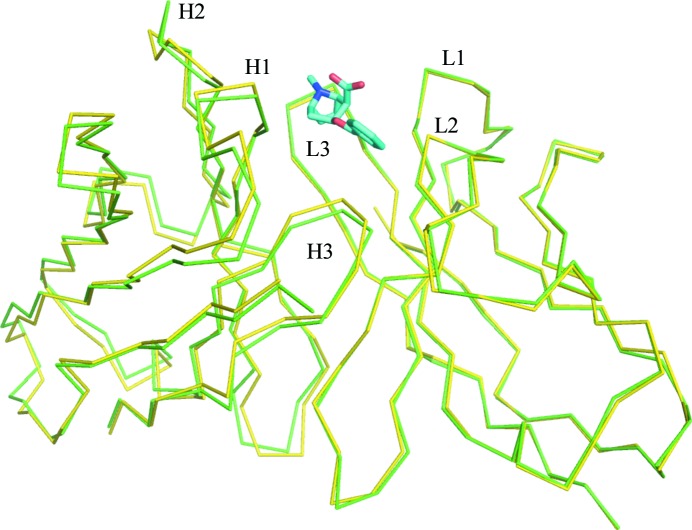
Figure 4.
A view of the Cα trace of the structural overlap of unliganded and liganded h2E2 Fab. The light-chain V domains are superposed to illustrate the deviations in the heavy-chain variable domain. Complex/liganded Fab is in green and free/unliganded Fab is in yellow. The ligand is shown as a stick drawing (C atoms in cyan, O atoms in red, N atoms in blue). The VH domain is on the left and the VL domain is on the right. The CDR loops are labeled.

