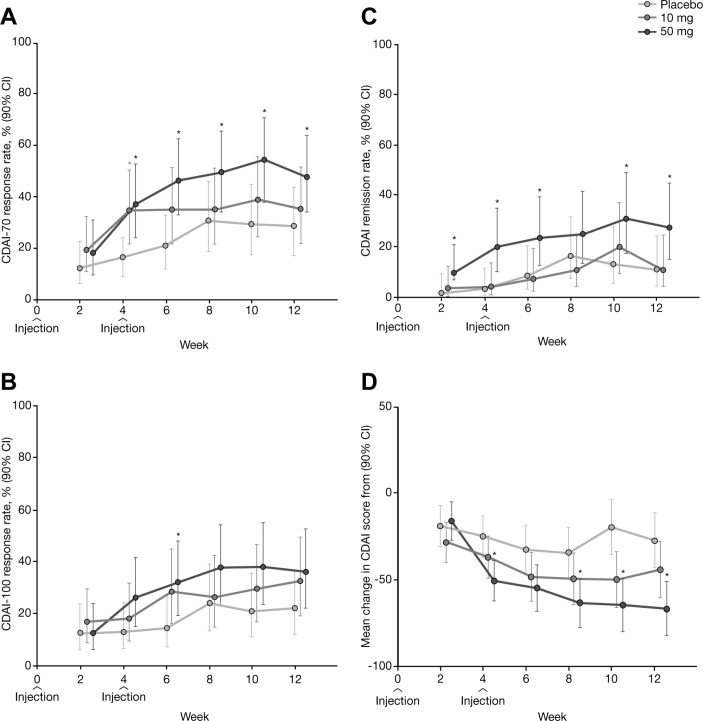
Figure 3.
CDAI outcomes from week 2 to week 12 by treatment group: (A) CDAI-70 response rate; (B) CDAI-100 response rate; (C) CDAI remission rate; and (D) mean changes in CDAI score from baseline (generalised linear mixed model; modified intention-to-treat population). *P<0.05 versus placebo. CDAI, Crohn’s Disease Activity Index; CDAI-70/100, proportion of patients who achieved a 70/100-point reduction in CDAI score.

