Figure 3.
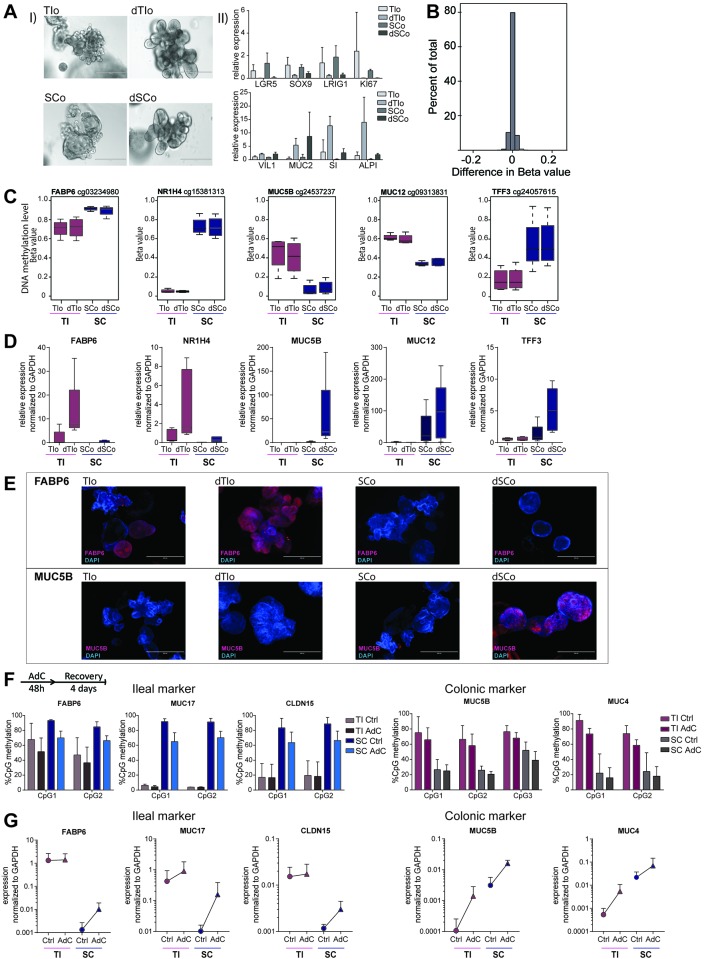
DNA methylation-dependent, gut segment-specific induction of gene expression in intestinal epithelial organoids (IEOs) during in vitro differentiation. (A) (I) Brightfield images of terminal Ileum (TI) and sigmoid colon (SC)-derived IEOs in maintenance medium (TIo and SCo), and differentiation medium (dTIo and dSCo), showing change of gross phenotype and (II) change in intestinal stem cell and epithelial cell subset marker expression measured by real-time PCR. (B) Histogram of mean difference in DNA methylation (expressed as beta values) of all ~450K tested CpGs comparing differentiated with matched undifferentiated intestinal organoids, n=8 derived from four patients (C) DNA methylation level of selected CpGs showing stable gut segment-specific differences in undifferentiated and differentiated IEOs, boxplot of n=4 derived from four patients for each group. Array cg-identifier is listed on top. (D) Real-time PCR data showing induction of gene expression during in vitro differentiation, n=5 per group. (E) Immunofluorescent staining of undifferentiated and differentiated IEOs forFABP6 (red, upper panel) and MUC5B (red, lower panel) protein expression. Blue=DAPI, cell nuclei. (F) CpG methylation quantified by pyrosequencing located within ileal and colonic marker genes in IEOs at baseline (Ctrl) and after co-culture with DNA methyltransferase inhibitor (Aza-deoxycytidine (AdC)) over 48 hours followed by a 4-day recovery period. Data shown as mean+SD of n=4 per group. (G) Gene expression of the markers in (F) shown as absolute values normalised to glyceraldehyde-3-phosphate dehydrogenase (GAPDH). Mean+SD, n=3–4 per group. KI67, marker of proliferation Ki-67; LRIG1, leucine-rich repeats and immunoglobulin-like domains 1; SI, sucrase isomaltase; SOX9, SRY Box 9; VIL1, villin 1.

