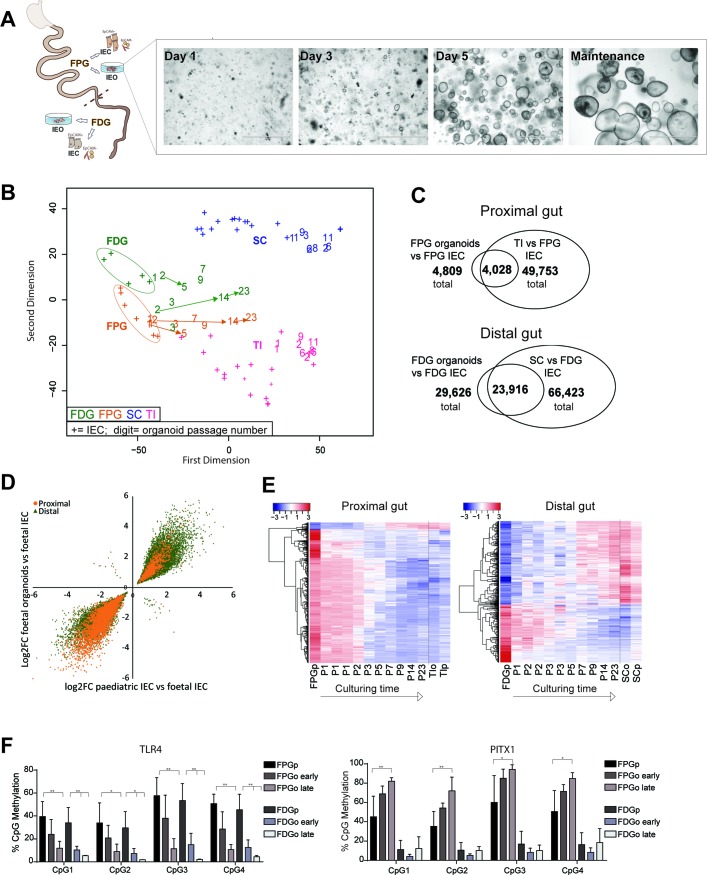
Figure 4.
DNA methylation dynamics of human fetal intestinal epithelial organoids (IEOs). (A) Schematic illustration of fetal sample processing and brightfield microscopy images of fetal IEOs at time points 1, 3 and 5 days after seeding and under long-term maintenance conditions. (B) Multidimensional scaling plot of genome-wide DNA methylation profiles of fetal primary intestinal epithelial cells (IECs) and organoids derived from fetal proximal gut (FPG) and fetal distal gut (FDG). Data are displayed in the context of paediatric samples (see figure 1). ‘+’ indicates purified IEC, ‘number’ represents IEO sample and indicates passage. Arrows indicate longitudinal samples of the same IEO line. Fetal organoids: n=10 from eight individuals, paediatric organoids: n=10 from seven individuals (ie, three longitudinal samples). (C) Venn diagrams displaying significant differentially methylated positions (DMPs) (adj. p<0.01) and their overlaps comparing fetal IECs versus fetal IEOs (n=5–10 per group) and fetal IECs versus paediatric IECs (n=5–6 and 16). (D) Correlation plot of fold changes (log2FC) of the overlapping DMPs from (C) (‘maturation-associated DMPs’), indicating that nearly all DMPs show the same direction (ie, higher or lower methylation in fetal IEC with almost 100% concordance for small intestine, 99.7% concordance for large intestine. Correlation: Pearson’s r=0.946 (proximal) and 0.956 (distal), both adj p<0.0001). (E) Heatmap of the top 1000 overlapping DMPs between fetal versus paediatric IECs and fetal IECs versus IEOs (see C) with fetal organoids ordered according to passaging times (P1–P23). As a reference, fetal IECs and paediatric sample values are shown as group average (n=5–16). (F) DNA methylation assessed by pyrosequencing of CpGs located in the promoter region of Toll-like receptor 4 (TLR4), left, and paired-like homeodomain 1 (PITX1), right, during culture of fetal organoids. Sample groups are fetal IEC, early fetal organoids (passage ≤3) and late fetal organoids (passage ≥10). Mean+SD, n=4–5 per group, *p<0.05 and **p<0.01 versus IEC. See also online supplementary figure S4. FDGo, FDG organoids; FDGp, FDG purified epithelium; FPGo, FPG organoids; FPGp, FPG purified epithelium; SC sigmoid colon; TI, terminal ileum.

