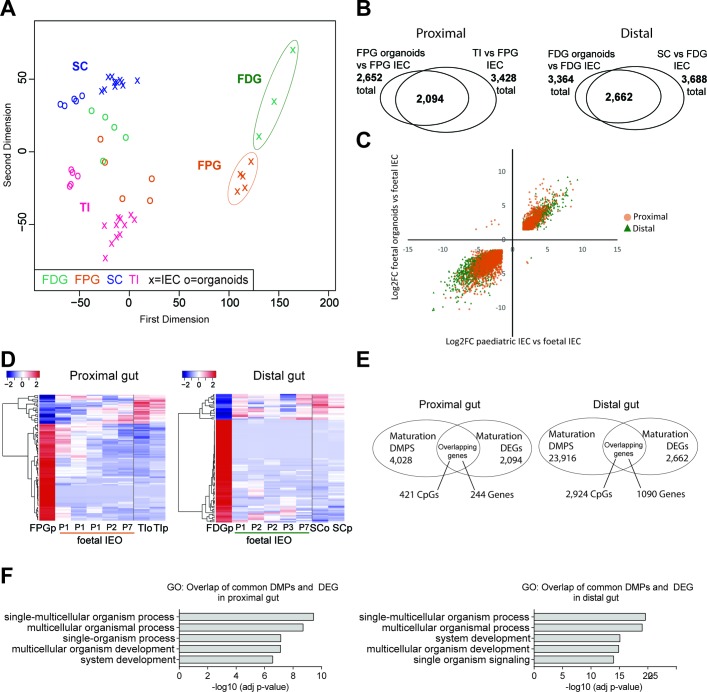
Figure 5.
Transcriptional profiling of human fetal intestinal epithelial organoids (IEOs) and correlation with DNA methylation. (A) Multidimensional scaling plot of transcriptome data from fetal intestinal epithelial cells (IECs) and fetal organoids in the context of paediatric primary IECs. (B) Overlap of differentially expressed genes (DEGs) between fetal IEC versus fetal IEOs, and fetal IEC versus paediatric IEC (n=3–5 per fetal group, n=11 per paediatric group), separated for small intestine (left) and large intestine (right). DEG cut-off adj p<0.01 and log2FC>±1.5. (C) Scatterplots of log2FC values for each overlapping DEG transcript from the comparisons in (B). Pearson’s correlation r=0.94 (proximal) and r=0.96 (distal), both p<0.001. (D) Heatmap of top 1000 DEGs previously identified between fetal and paediatric IEC, shown in fetal organoids. Passage number indicated as ‘P’. (E) Venn diagram of overlapping genes that are both differentially methylated and expressed. (F) Five most significant gene ontologies (biological process) for genes both differentially methylated and differentially expressed in vivo and in vitro (see figures 4C and 5B), analysed individually for proximal and distal gut. See also online supplementary figure S5. DMPS, differentially methylated positions; FDG, fetal distal gut; FPG, fetal proximal gut; SC, sigmoid colon; TI, terminal ileum.

