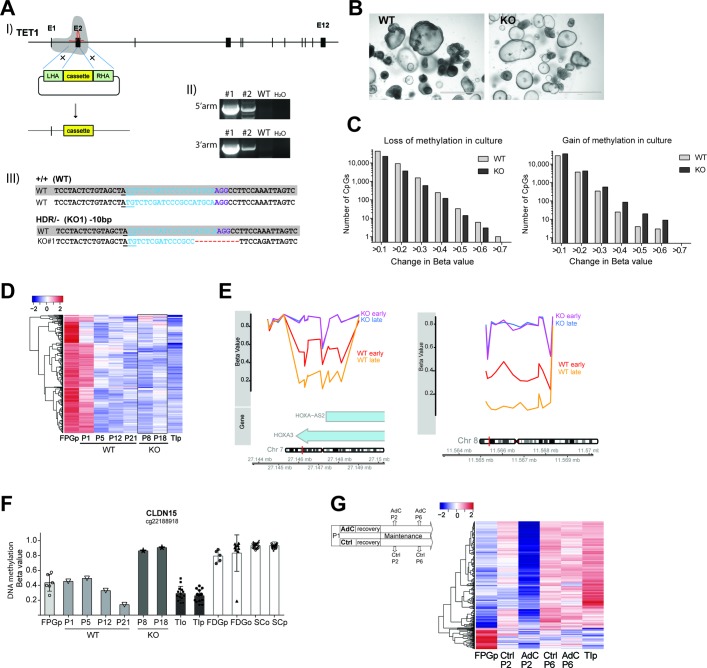
Figure 6.
Involvement of ten-eleven translocation 1 (TET1) and DNA methyltransferases (DNMTs) in observed in vitro maturation of human fetal intestinal epithelial organoids (IEOs). (A) Gene targeting of TET1 in fetal IEOs: (I) Schematic display of targeting strategy using CRISPR-Cas9 and targeting vector, (II) confirmation of homology-directed repair (HDR) by PCR. Knockout (KO) line 1 (#1) was used for subsequent analysis. (III) Sequencing results of TET1 allele in WT and KO#1 samples aligned to reference. Underline indicates start codon; blue colour indicates gRNA target sequence, purple indicates PAM site. (B) Brightfield images of unaltered fetal proximal gut organoids (FPGo), that is, wildtype (WT) and TET1- KO fetal small intestinal IEOs derived from the same individual. (C) Quantification of DNA methylation change between two culturing time points in WT and TET1- KO. Plotted are the number of CpG positions displaying either loss (left) or gain (right) of DNA methylation in KO compared with WT organoids during culture. Time points analysed were WT P12 and P21, KO P8 and P18. p=0.02 (loss) and p=0.03 (gain), paired Wilcoxon test. (D) Heatmap displaying DNA methylation of top 1000 maturation-associated differentially methylated positions (see figure 4C) that lose DNA methylation, shown in the respective organoid. (E) Example of differentially methylated regions (DMRs) in the genes for the transcription factors homeobox A3 (HOXA3, left) and GATA binding protein 4 (GATA4, right) between WT and KO at two different time points in culture. KO early=P8, KO late=P18, WT early=P12, WT late=P21. (F) Beta values of CpG methylation in CLDN15 at different passages shown in the context of other sample groups. Each symbol represents a sample, bar indicates the average. (G) Effect on dynamic DNA methylation changes in response to treatment with DNMT inhibitors. Heatmap displaying DNA methylation of top 1000 maturation-associated DMPs that gain methylation between fetal and paediatric small intestinal IEC, shown in FPGo at different passages after treatment with Aza-deoxycytidine (AdC). FPG purified epithelium (FPGp) shown as average of n=6, terminal ileum purified (TIp) shown as average of n=16, FPGo shown as average of n=2 per condition. See also online supplementary figures S6 and S7.

