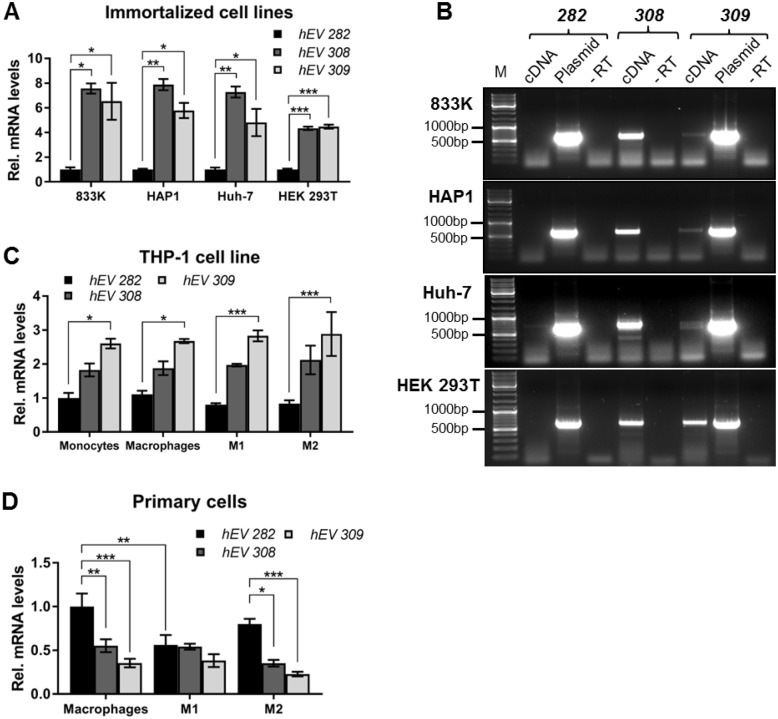
Fig 2. Transcript levels of hENDOV.
(A) hENDOV transcript levels were analyzed by RT-qPCR in 833K, HAP1, Huh-7 and HEK 293T cell lines. Primers specific for hENDOV 282 (hEV 282), hENDOV 308 (hEV 308) or hENDOV 309 (hEV 309) 3’-termini were used. The amount of each isoform is relative to hENDOV 282 in each cell line. One-way ANOVA with a post hoc Tukey’s test was used to calculate the statistical significance in each cell line (n = 3–6). *p < 0.05; **p < 0.01; ***p < 0.001. (B) hENDOV transcript presence was analyzed by PCR in 833K, HAP1, Huh-7 and HEK 293T cell lines. An exon 2/3 junction primer was used in pair with 3’-specific primers for hENDOV 282 (282), hENDOV 308 (308) or hENDOV 309 (309). Plasmids for hENDOV 282 and hENDOV 309 were included as positive controls for the specific PCRs. A cDNA sample without reverse transcriptase (-RT) added in the reaction was included as negative control. PCR products were analyzed by gel electrophoresis and sizes in base pairs (bp) of the DNA marker (M) are indicated. (C) hENDOV transcript levels were analyzed by RT-qPCR in the THP-1 cell line (monocytes, monocytes differentiated to macrophages, and macrophages polarized to M1 or M2) with 3’-specific primers, as described in A. The amount of each isoform is relative to hENDOV 282 in monocytes. Two-way ANOVA with a post hoc Tukey’s test was used to calculate the statistical significance (n = 3–4); analysis of simple effects (*p < 0.05; ***p < 0.001). (D) hENDOV transcript levels were analyzed by RT-qPCR in primary human macrophages and macrophages polarized to M1 or M2 with 3’-specific primers, as described in A. The amount of each isoform is relative to hENDOV 282 in macrophages. Two-way ANOVA with a post hoc Tukey’s test was used to calculate the statistical significance (n = 7–8); analysis of simple effects (*p < 0.05; **p < 0.01; ***p < 0.001).

