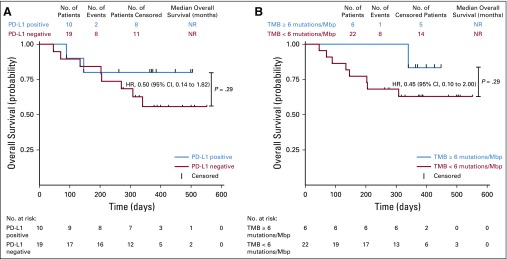
FIG A4.
Kaplan-Meier plots of median overall survival of (A) Patients who are PD-L1 positive versus PD-L1 negative. (B) TMB ≥ 6 mutations/Mbp versus TMB < 6 mutations/Mbp patients. HR, hazard ratio; Mbp, million base pairs; NR, not reached; PD-L1, programmed death ligand-1; TMB, tumor mutational burden.

