. 2019 Oct 30;8:e49910. doi: 10.7554/eLife.49910

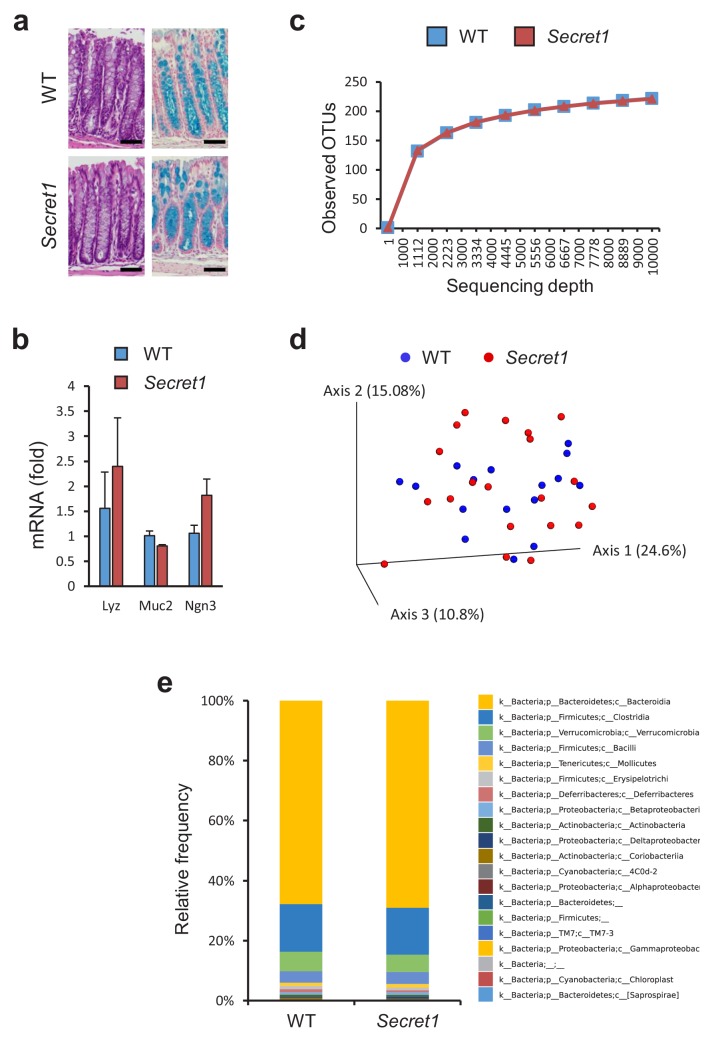
Figure 4. Scgn deficient mice display intact mucosal architecture and microbiota at baseline.

(a) Representative colon histologic images from Secret1 and WT animals under untreated conditions. HE is shown on the left, alcian blue staining on the right. Scale bar 100 µm. (b) Baseline expression of prototypical intestinal epithelial cell lineage-specific markers from small bowel in Secret1 and WT mice was determined by qRT-PCR (n = 3 in each group). (c) Microbiome alpha diversity as measured by observed OTU mean counts of fecal 16 s rRNA sequencing. (d) Beta diversity by unweighted UNIFRAC principal coordinate analysis (PCoA) of fecal 16 s rRNA sequencing. (e) Class level taxonomic composition for stool 16 s sequencing. WT n = 16 Secret1 n = 20. S.E.M. was used for error bars in (b).

Figure 4—source data 1. Source data for Figure 4B.
DOI: 10.7554/eLife.49910.022
Figure 4—source data 2. Source data for Figure 4C.
DOI: 10.7554/eLife.49910.023
Figure 4—source data 3. Source data for Figure 4E.
DOI: 10.7554/eLife.49910.024

Figure 4.

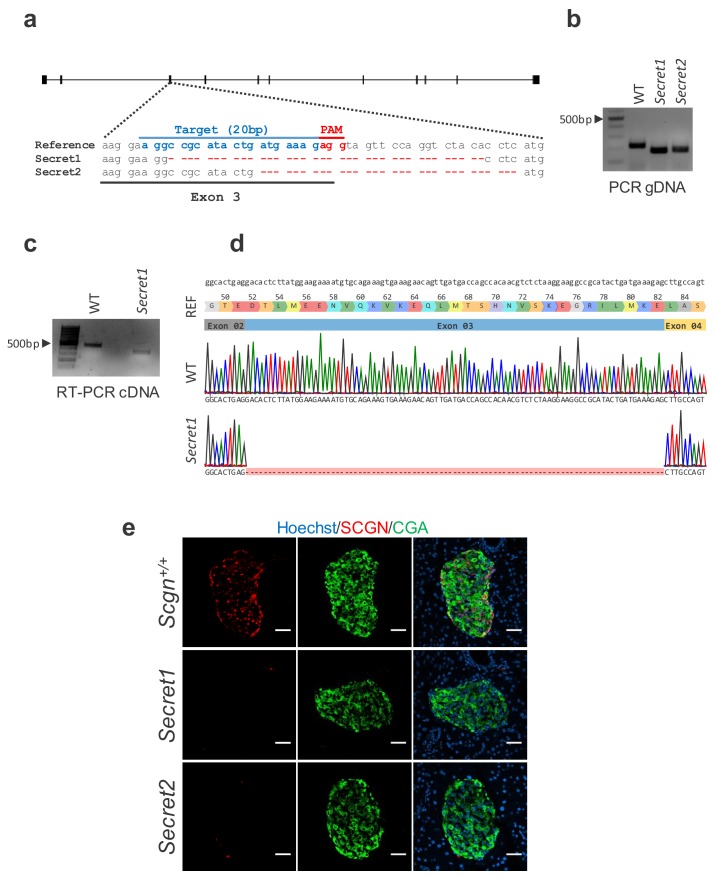
Figure 4—figure supplement 1. Engineering Scgn deficient animals.

Figure 4—figure supplement 1.

(a) Diagram of CRISPR/Cas9 targeted exon 3 of Scgn. 20 nucleotide guide RNA sequence (blue), PAM (red). Reference sequence (top) and sequences from founder animals (middle and bottom) with varying length deletions are depicted. (b) Genotyping of mice carrying CRISPR/Cas9 induced deletions. (c) RT-PCR for Scgn using RNA extracted from colonocytes from WT and Secret1 animals. (d) Sequence alignment of WT and Secret1 Sanger sequencing results of RT-PCR product. (e) Fluorescent immunostaining of SCGN and CGA in pancreatic islets of Scgn sufficient (Scgn+/+) and Scgn deficient (Secret1 and Secret2) mouse lines. Scale bar 50 µm.