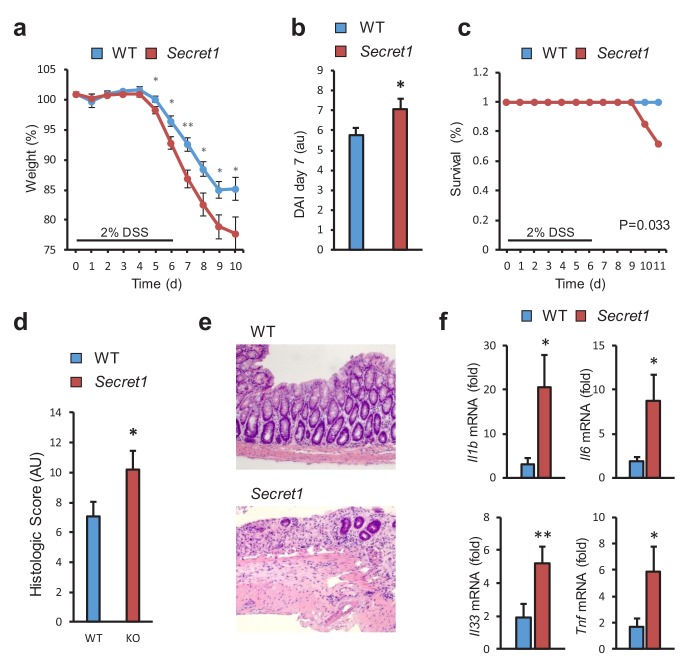
Figure 5. SCGN loss leads to increased sensitivity to DSS colitis.
(a–c) Body weight, disease activity index (DAI), and survival of male WT (n = 13) and Secret1 (n = 13) mice treated for 6 days with 2% DSS in their drinking water. (d) Histologic score of male and female WT (n = 11) and Secret1 (n = 13) animals treated for 6 days with 2% DSS. (e) Representative microphotographs (20x) of colonic epithelium of DSS-treated mice. (f) Inflammatory gene expression measured by qRT-PCR from ceca of DSS-treated mice. Data in (a), (b) and (c) are representative of 2 experiments. *p<0.05. **p<0.01, two tailed unpaired t test in (a), (b) and (f). *p<0.05. one tailed unpaired t test in (d). S.E.M. was used for error bars in (a), (b), (d), (f). Log rank test was used in (c).
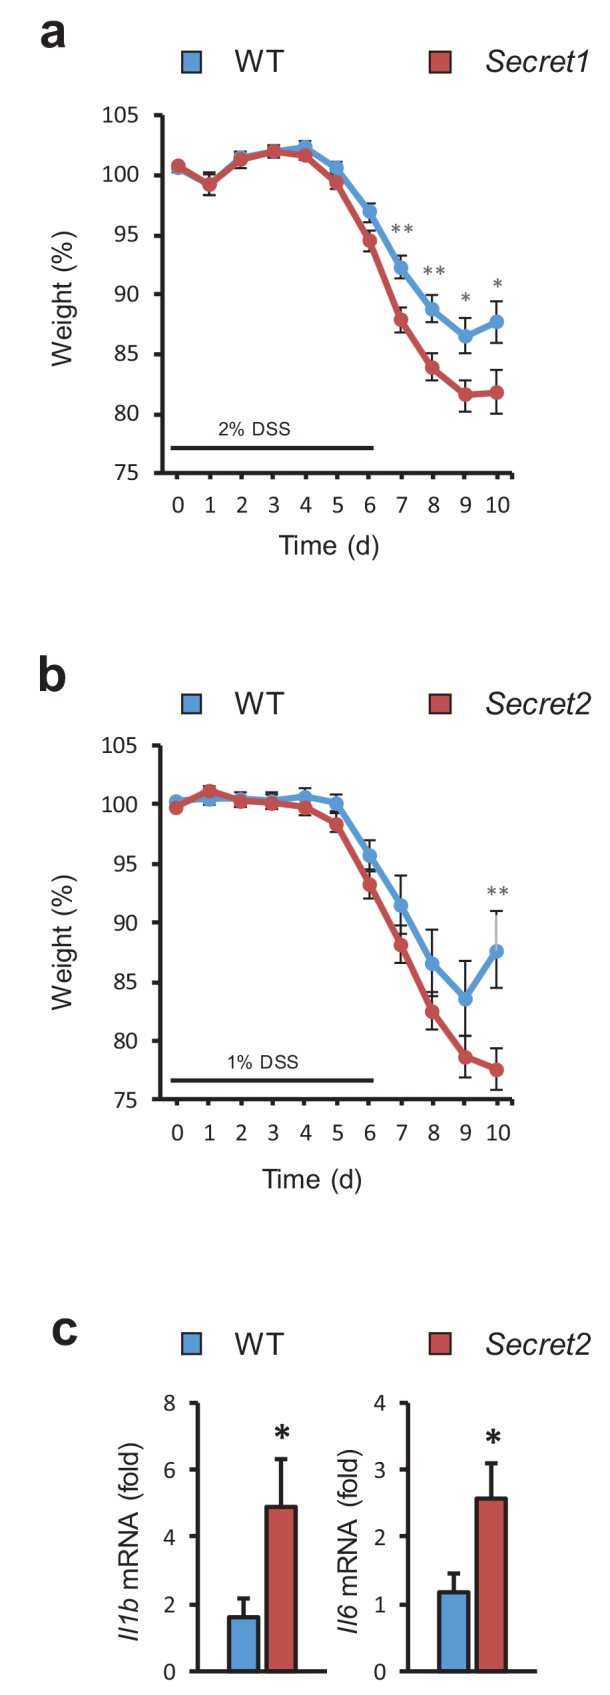
Figure 5—figure supplement 1. Increased sensitivity to DSS in Scgn deficient animals.


