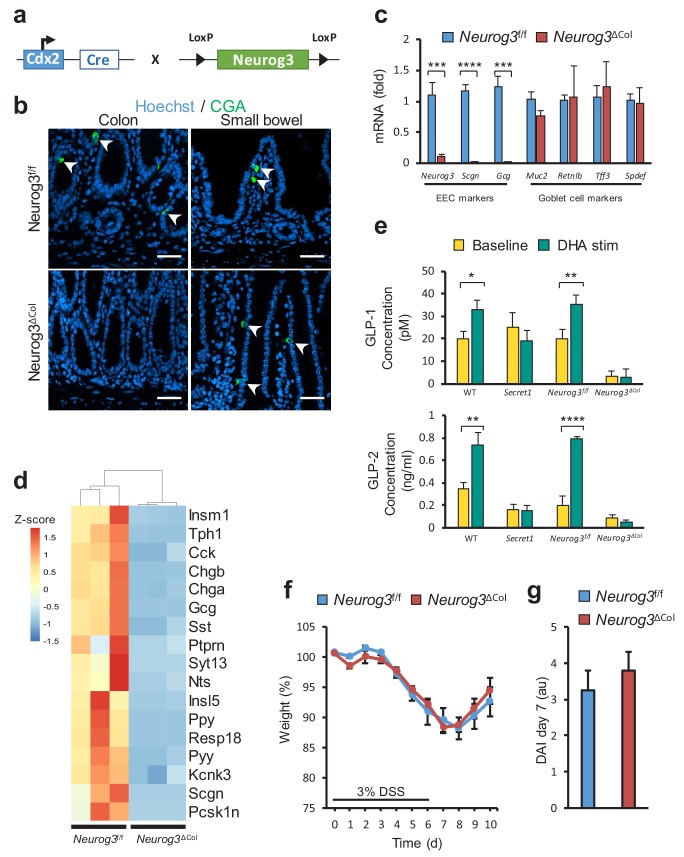
Figure 6. Loss of colonic EECs does not confer DSS susceptibility.
(a) Diagram depicting the mating strategy used to generate colonic EEC (Neurog3ΔCol) deficient mice. (b) CGA immunofluorescent staining of colon and small bowel from wild-type (Neurog3f/f) and colonic EEC deficient (Neurog3ΔCol) mice (c) qRT-PCR of epithelial lineage makers from colonic epithelium from Neurog3f/f and Neurog3ΔCol mice (n = 3 in each group). (d) Heat map presentation of top differentially expressed genes from RNA-seq of colonic epithelia of Neurog3f/f and Neurog3ΔCol mice. (e) Ex-vivo basal and DHA-stimulated GLP-1 and GLP-2 secretion from colonic explants of Secret1 and EEC deficient mice. (GLP-1: Neurog3f/f n = 7, Neurog3ΔCol n = 6, WT n = 6, Secret1 n = 6) (GLP2: Neurog3f/f n = 5, Neurog3ΔCol n = 5, WT n = 6, Secret1 n = 4). Bars represent the mean and error bars the S.E.M. (f–g) Body weight and DAI of conventionally raised Neurog3f/f and Neurog3ΔCol mice treated for 6 days with 3% DSS (n = 15 in each group). Scale bar in (b) 50 µm. *p<0.05, **p<0.01, ***p<0.001 ****p<0.0001 two tailed unpaired t test in (c) and (e). S.E.M. was used for error bars in (c), (e), (f) and (g).

