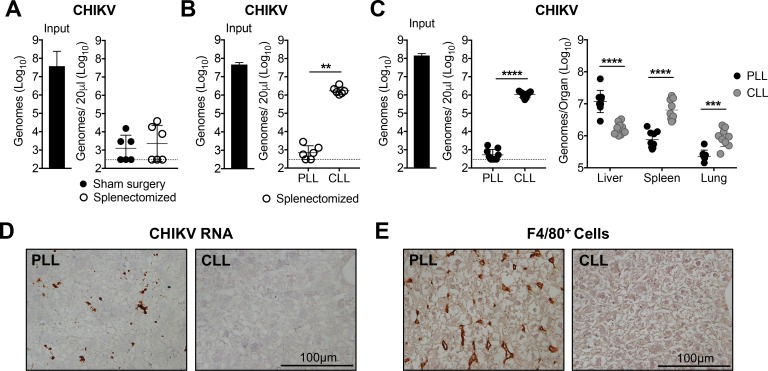
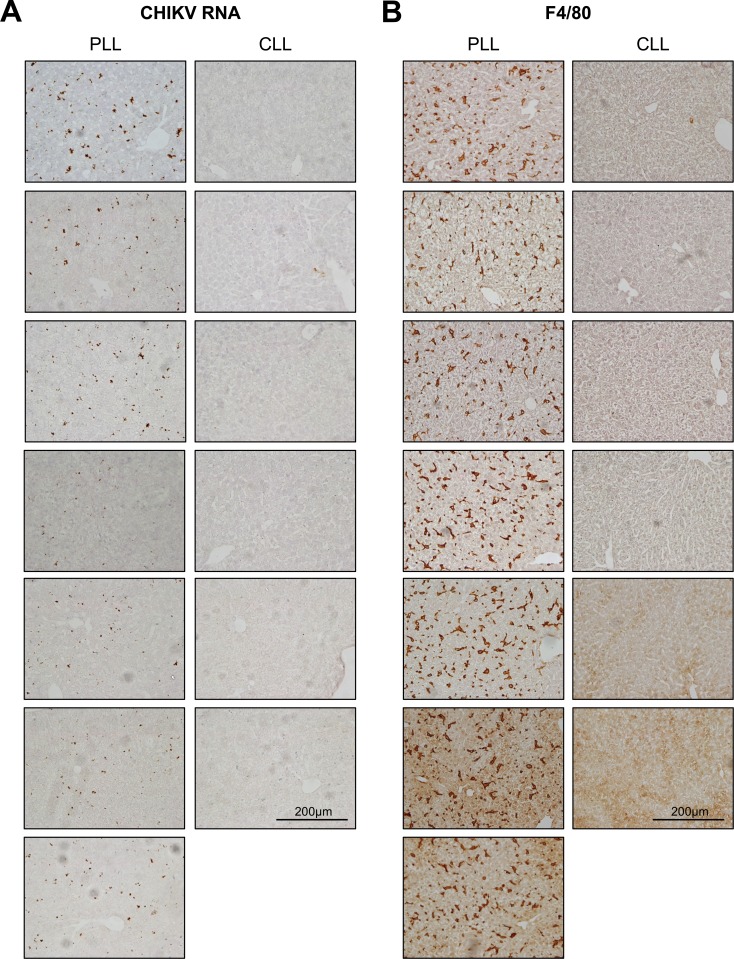
Figure 2. Liver Kupffer cells clear CHIKV from the circulation.
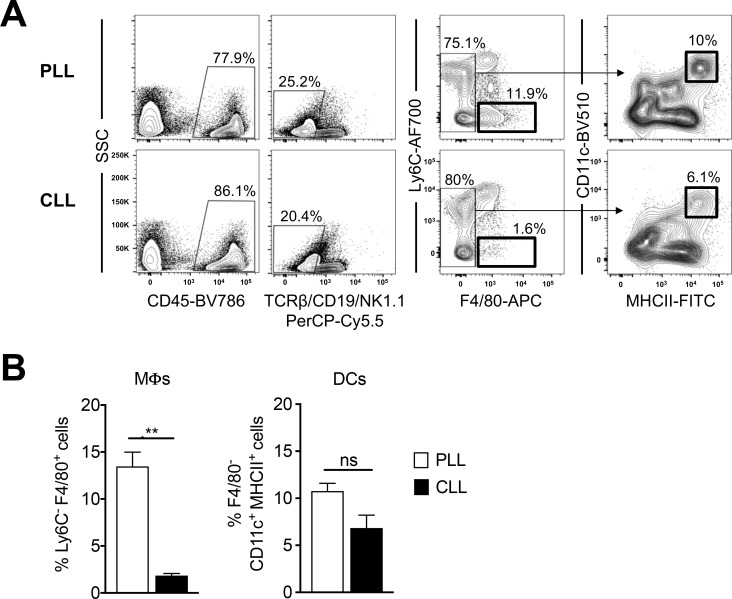
(A) WT C57BL/6 mice that underwent a sham or splenectomy surgery were inoculated i.v. with CHIKV and viral genomes in the inoculum and serum at 45 min post-inoculation were quantified by RT-qPCR. Mean ± SD. N = 6, two experiments. Mann-Whitney test; p>0.05. (B) Splenectomized WT C57BL/6 mice were treated i.v. with PLL or CLL. At 42 hr post-treatment, mice were inoculated i.v. with CHIKV and viral genomes in the inoculum (input) and serum at 45 min post-inoculation were quantified by RT-qPCR. Mean ± SD. N = 6, two experiments. Mann-Whitney test; **p<0.01. (C) WT C57BL/6 mice were treated and inoculated as in (B), and viral genomes present at 45 min post-inoculation in the serum or indicated tissues were quantified by RT-qPCR. Mean ± SD. N = 9, two experiments. Mann-Whitney test or Two-tailed t-test; ***p<0.001, ****p<0.0001. (D and E) WT C57BL/6 mice were treated as in (B) and inoculated with CHIKV at 42 hr post-treatment. Livers were collected at 45 min post-inoculation, and RNA Scope in situ hybridization (D) or IHC (E) were performed to visualize viral RNA localization or F4/80+ macrophages, respectively. Brown staining is indicative of viral RNA (D) or F4/80+ macrophages (E). N = 6–7, two experiments. Figure 2—figure supplement 1 shows representative images of CHIKV RNA Scope in situ hybridization and F4/80 IHC for all biological replicates, and Figure 2—figure supplement 2 shows flow cytometry analysis of liver macrophages and dendritic cells (DCs) in PLL- and CLL-treated mice.


