Figure 5.
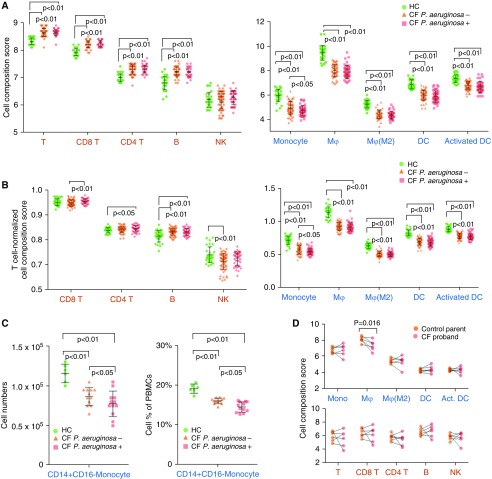
Analysis of immune cell subset composition in Pseudomonas aeruginosa–positive and –negative samples. (A and B) Raw (A) and T cell–normalized (B) composition scores of all cell subsets in HC and CF subgroups. (C) Cell numbers (left) and cell subset frequencies (right) of CD14+ CD16− monocytes in PBMCs stimulated by CF and HC serum. (D) Composition scores of 10 major cell subsets in 6 CF probands (CFPs) compared with those of their mothers. Lines connecting the dots indicate pairs of children and mothers. Cell subset scores were evaluated across all 143 subjects in the validation cohort.

